• 论文
主办单位:煤炭科学研究总院有限公司、中国煤炭学会学术期刊工作委员会
测线布设形态与测点缺失对采煤沉陷预计参数反演的影响
  • Title

    Impacts of observation line layout morphology and survey point missing on the inversion of subsidence prediction parameters

  • 作者

    郭庆彪余庆郑美楠罗锦

  • Author

    GUO Qingbiao;YU Qing;ZHENG Meinan;LUO Jin

  • 单位

    安徽理工大学 空间信息与测绘工程学院安徽理工大学 煤矿安全高效开采省部共建教育部重点实验室安徽理工大学 矿业工程学院

  • Organization
    School of Geomatics, Anhui University of Sciences and Technology
    Key Laboratory of Safe and Effective Coal Mining Ministry of Education, Anhui University of Sciences and Technology
    School of Mining Engineering, Anhui University of Sciences and Technology
  • 摘要

    【目的】准确的采煤沉陷预计参数是实现全周期绿色开采的重要基础依据,基于测线沉陷数据进行反演是获取上述参数的主要手段。【方法】为定量分析测线布设形态与测点缺失对采煤沉陷预计反演的影响,在基于黑猩猩优化算法构建概率积分模型沉陷预计参数反演方法的基础上,结合数值模拟实验反演得到6种测线形态和3个不同位置(最大下沉区域、边界区域和拐点区域)测点缺失时的采煤沉陷预计参数,并揭示其对参数反演结果的影响机理。【结果和结论】结果表明:采用黑猩猩优化算法反演的参数精度较高,下沉系数q的中误差均不超过0.01,影响角正切值tanβ的中误差不超过0.04,开采影响传播角θ0的中误差约为1.1,平均拐点偏移距s0的中误差优于10 m。观测线形态改变对θ0影响较小,但对q、tanβs0影响较大,当观测线布设成非标准形态时,单纯依赖参数反演方法可能导致反演结果的失真。当工作面为非充分采动时,最大下沉区域测点缺失对tanβθ0影响不大,但随着最大下沉区域缺失测点的增多,最大下沉信息含量逐渐减小,qs0会逐渐减小。边界区域测点缺失对参数反演影响较小,但会影响下沉盆地移动范围及边界角、移动角等角量参数的确定。拐点区域测点缺失占比不超过40%时,测点缺失对参数反演影响较小,但拐点区域测点缺失占比超过40%时,随着缺失测点的增多,曲线形态失去控制,qs0会逐渐减小,而tanβ逐渐增大。由于采煤沉陷预计参数间具有强相关性,在适应度函数准则为预测残差平方和最小的约束下,当测线形态改变或测点缺失时,可通过缩小参数寻优范围或插值方法削弱其对参数反演结果的影响。

  • Abstract

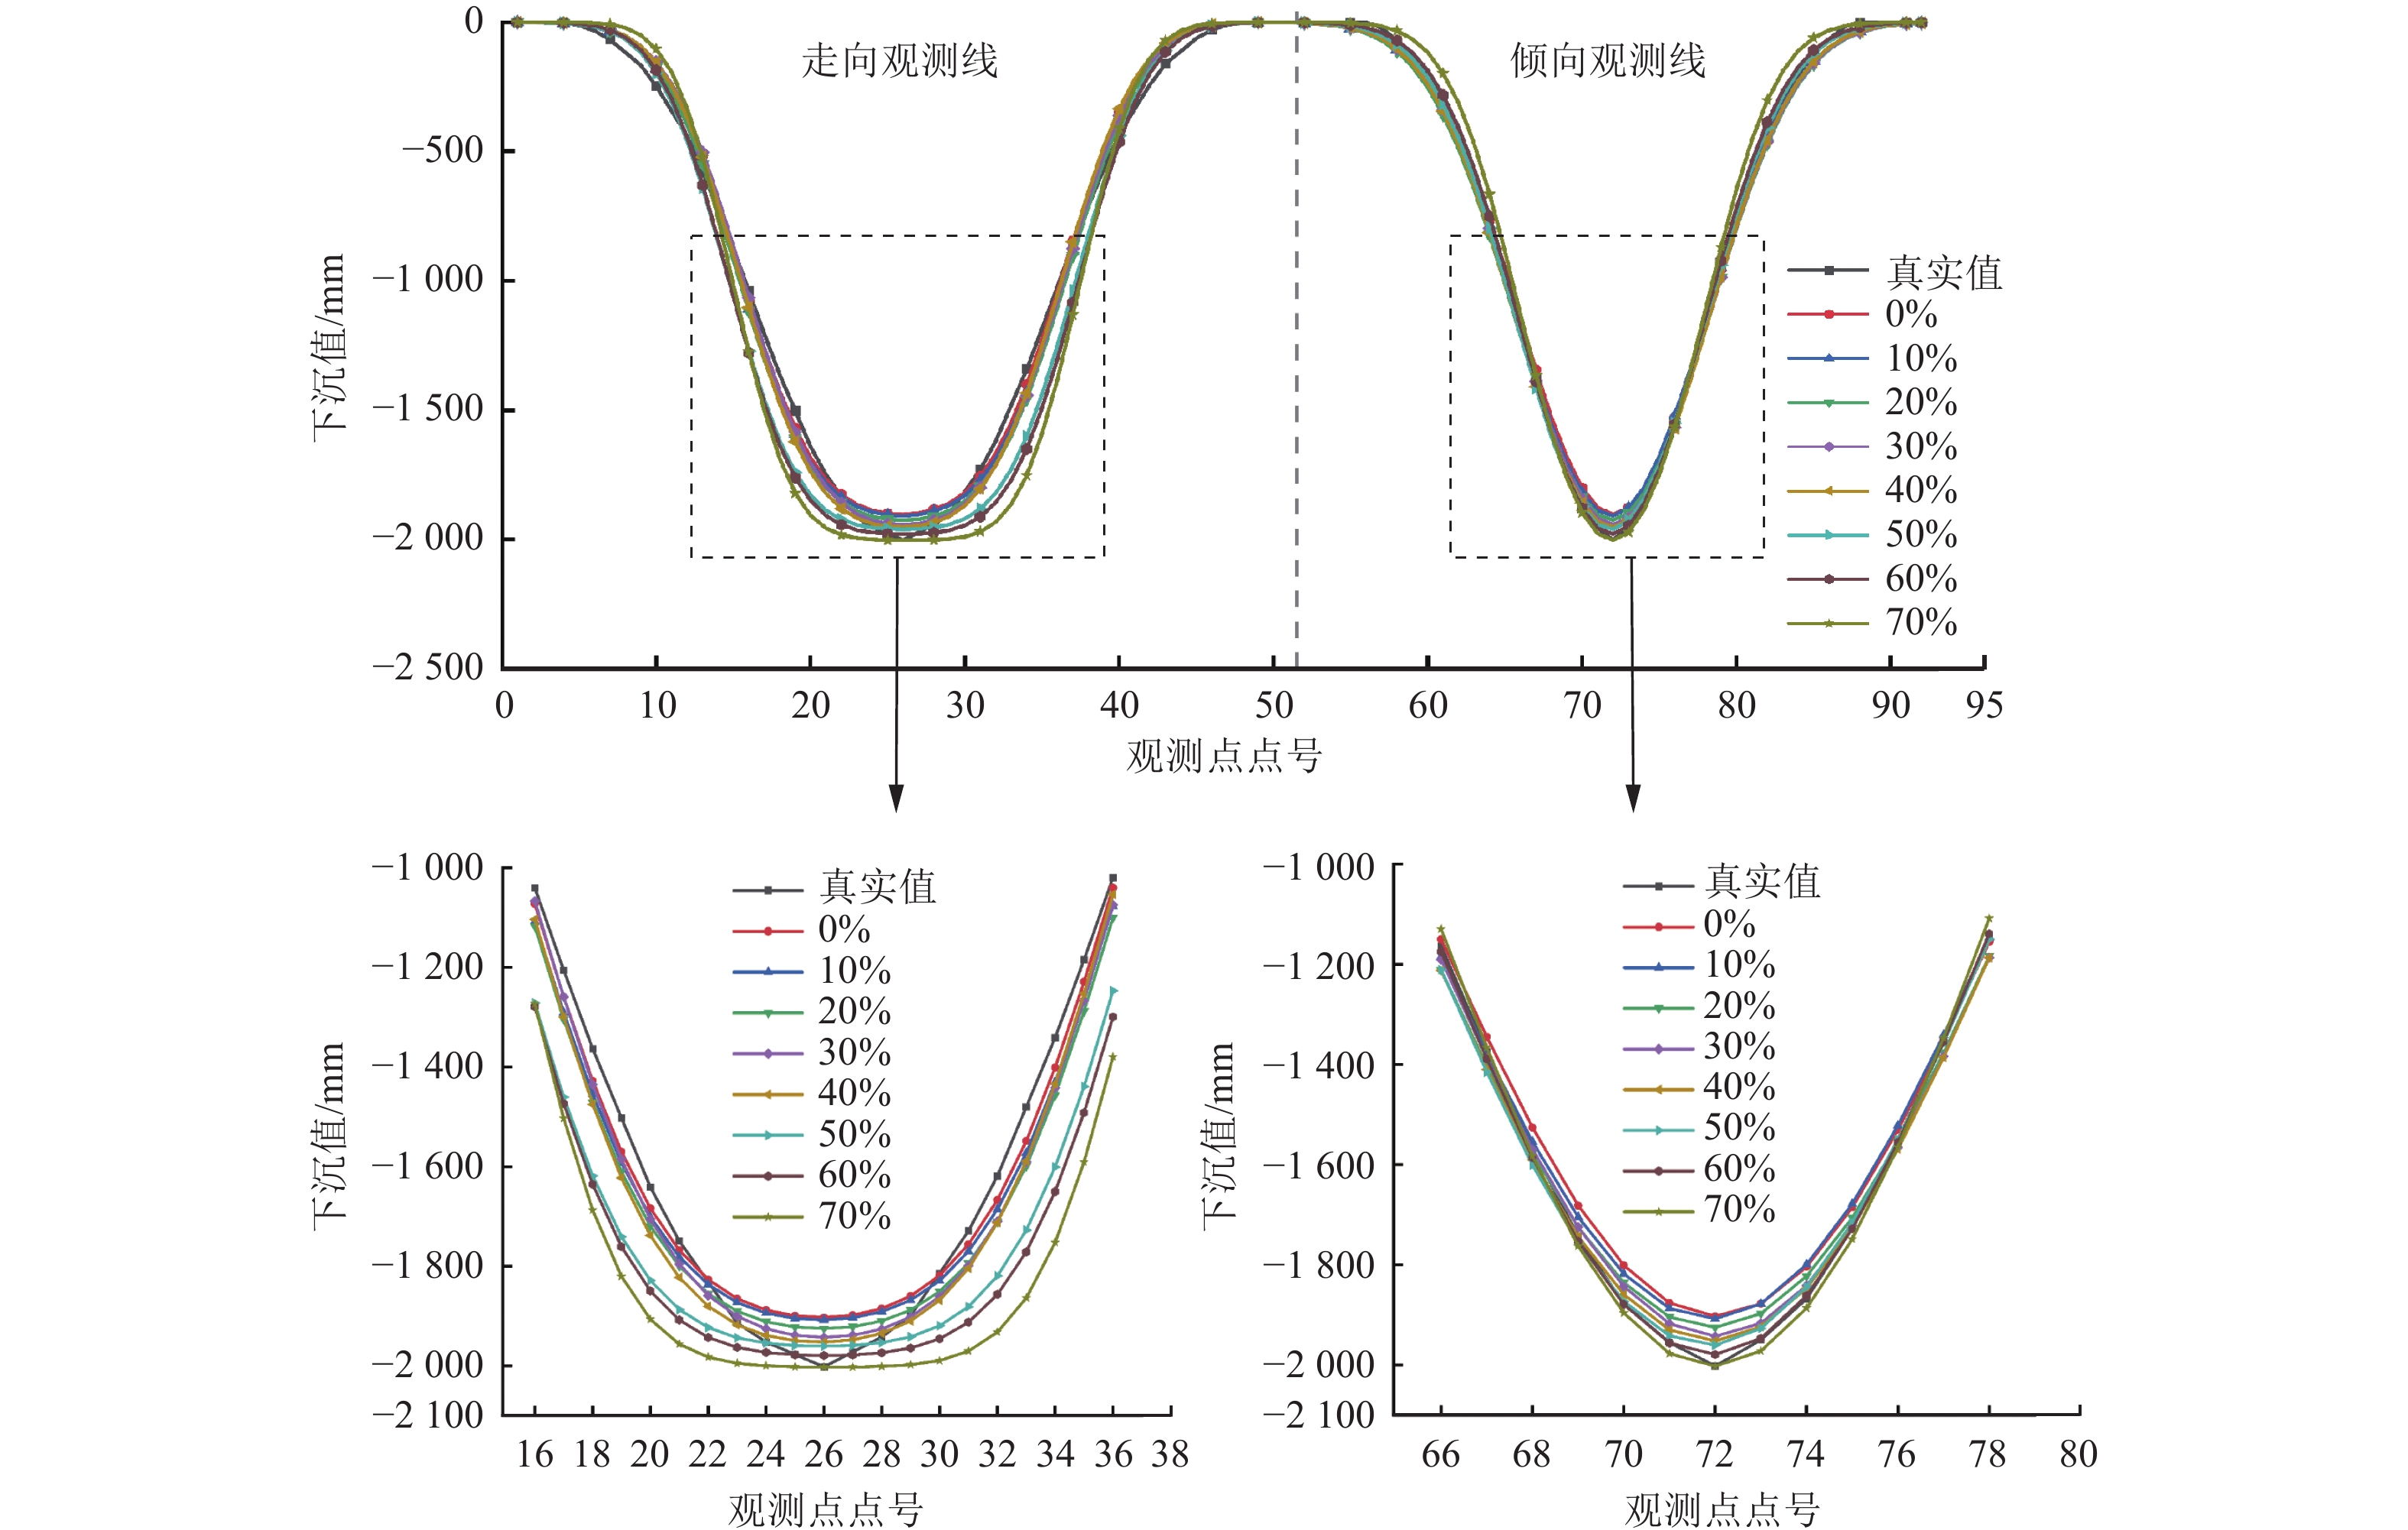
    [Objective] Accurate subsidence prediction parameters prove to be an important basis for full cycle green coal mining, while inversion based on the subsidence data of observation lines serves as the main method to obtain these parameters. [Methods] To quantitatively analyze the impacts of the observation line layout morphology and survey point missing on the inversion of subsidence prediction parameters, this study developed a probability integral model-based inversion method for these parameters using the chimpanzee optimization algorithm (ChOA). Using this method combined with digital simulation experiments, this study obtained the subsidence prediction parameters under six observation line morphologies and survey point missing in three different areas: the maximum subsidence area, the boundary area, and the inflection point area. Furthermore, this study revealed mechanisms for the impacts of these observation line morphologies and survey point missing on the parameter inversion results. [Results and Conclusions] The results indicate that the inversion using ChOA yielded accurate subsidence prediction parameters, with the mean square errors of subsidence coefficient q, influence angle tangent tanβ, mining influence propagation angle θ0, and average inflection point offset s0 being below 0.01, below 0.04, about 1.0, and above 10 m respectively. The changes in the observation line layout morphology produced minor impacts on θ0 but greatly influenced q, tanβ, and s0. In the case of non-standard observation line morphologies, relying solely on the parameter inversion method may lead to the distortion of inversion results. In the case of the insufficient mining of a mining face, the survey point missing in the maximum subsidence area had slight effects on tanβ and θ0. However, with an increase in the number of missing survey points in the maximum subsidence area, information on the maximum subsidence gradually shrank, which led to gradually decreasing q and s0. The survey point missing in the boundary area had small impacts on parameter inversion results but influenced the determination of the movement range of subsided basins, along with angular parameters such as boundary and movement angles. In the case where missing survey points in the inflection point area accounted for less than 40%, the survey point missing posed minor impacts on the parameter inversion. Otherwise, with an increase in the number of missing survey points, the subsidence curve morphology was out of control, q and s0 gradually decreased, while tanβ gradually increased. Given the strong correlations among these parameters, when the minimum sum of squares of prediction residuals acts as the criterion for the fitness function, it is feasible to reduce the impacts of changes in the observation line layout morphology or survey point missing on the parameter inversion results by narrowing the parameter optimization ranges and using interpolation.

  • 关键词

    开采沉陷参数反演概率积分模型观测线特征黑猩猩优化算法

  • KeyWords

    mining-induced subsidence;parameter inversion;probability integral model;observation line characteristic;chimpanzee optimization algorithm

  • 基金项目(Foundation)
    国家自然科学基金项目(52274164);安徽省优秀青年科学基金项目(2308085Y31);中国科协青年托举人才工程项目(2022QNRC001);煤炭开采水资源保护与利用国家重点实验室开放基金项目(GJNY-21-41-15);安徽省重点研究与开发计划项目( 202104a07020001)
  • DOI
  • 引用格式
    郭庆彪,余庆,郑美楠,等. 测线布设形态与测点缺失对采煤沉陷预计参数反演的影响[J]. 煤田地质与勘探,2024,52(6):1−12. DOI: 10.12363/issn.1001-1986.24.04.0229
  • Citation
    GUO Qingbiao,YU Qing,ZHENG Meinan,et al. Impacts of observation line layout morphology and survey point missing on the inversion of subsidence prediction parameters[J]. Coal Geology & Exploration,2024,52(6):1−12. DOI: 10.12363/issn.1001-1986.24.04.0229
  • 图表

    Table1

    模拟工作面参数反演结果
    指标 q tanβ θ0/(°) s1/m s2/m s3/m s4/m
    参数范围 [0.3,1.3] [1,3] [85,95] [−40,40] [−40,40] [−40,40] [−40,40]
    反演结果均值 0.84 1.13 89.71 31.30 28.05 17.18 23.68
    参数拟合中误差 0.0089 0.0352 1.0717 5.6359 9.6108 5.4203 9.1231

    Table2

    不同观测线形态参数反演结果
    观测线形式qtanβθ0s0下沉拟合中
    误差/mm
    平均值相对误差/%平均值相对误差/%平均值/(◦)相对误差/%平均值/m相对误差/%
    A0.8401.13089.71025.05045.0
    B0.7411.901.195.3189.230.538.6965.3149.1
    C0.7510.711.206.1989.420.328.9764.1949.4
    D0.7411.901.184.4289.800.108.2667.0245.7
    E0.769.521.195.3189.820.1210.8556.6949.9
    F0.7214.281.195.3189.160.619.4962.1157.2

    Table3

    最大下沉区域测点缺失的参数反演结果
    测点缺失
    占比/%
    qtanβθ0s0下沉值拟合中
    误差/mm
    与原最大下
    沉值之差/mm
    平均值相对误差/%平均值相对误差/%平均值/(◦)相对误差/%平均值/m相对误差/%
    1000.8401.13089.71025.05045.088.8
    900.804.761.102.6589.640.0815.1839.4057.8150.9
    800.7510.711.111.7789.760.068.6665.4378.8214.0
    700.7016.671.140.8889.950.272.7289.1497.1263.2
    600.6917.861.140.8889.270.491.1395.49117.6310.9
    500.6621.431.13089.930.24−6.98127.86144.9373.2
    400.6325.001.13089.030.76−8.19132.69176.0438.7

    Table4

    边界区域测点缺失的参数反演结果
    测点缺失
    占比/%
    qtanβθ0s0下沉值拟合中
    误差/mm
    平均值相对误差/%平均值相对误差/%平均值/(◦)相对误差/%平均值/m相对误差/%
    00.8401.13089.71025.05045.0
    200.8401.111.7789.640.0822.749.2246.9
    400.8401.093.5489.920.2320.7017.3647.0
    600.831.191.111.7789.770.0721.8612.7347.7
    800.822.381.111.7789.71021.0615.9348.9
    1000.831.191.102.6589.140.6322.709.3854.7

    Table5

    拐点区域测点缺失的参数反演结果
    测点缺失
    占比/%
    qtanβθ0s0下沉值拟合中
    误差/mm
    平均值相对误差/%平均值相对误差/%平均值/(◦)相对误差/%平均值/m相对误差/%
    00.8401.13089.71025.05045.0
    100.831.191.120.8889.720.0121.0216.0946.3
    200.813.571.13089.980.3016.1735.4551.4
    300.831.191.13089.820.1223.834.8747.1
    400.813.571.162.6589.180.5921.0216.0951.9
    500.787.141.227.9689.890.204.9680.2091.8
    600.795.951.2510.6289.940.266.5873.73104.4
    700.7411.901.4629.2089.830.136.1075.65136.4
相关问题

主办单位:煤炭科学研究总院有限公司 中国煤炭学会学术期刊工作委员会

©版权所有2015 煤炭科学研究总院有限公司 地址:北京市朝阳区和平里青年沟东路煤炭大厦 邮编:100013
京ICP备05086979号-16  技术支持:云智互联