
主办单位:煤炭科学研究总院有限公司、中国煤炭学会学术期刊工作委员会
Construction of a landscape ecological network based on landscape ecological risk assessment: A case study of the resource-based city of Linfen
ZHAO Jikai;YU Qiang;XU Chenglong;MA Jun
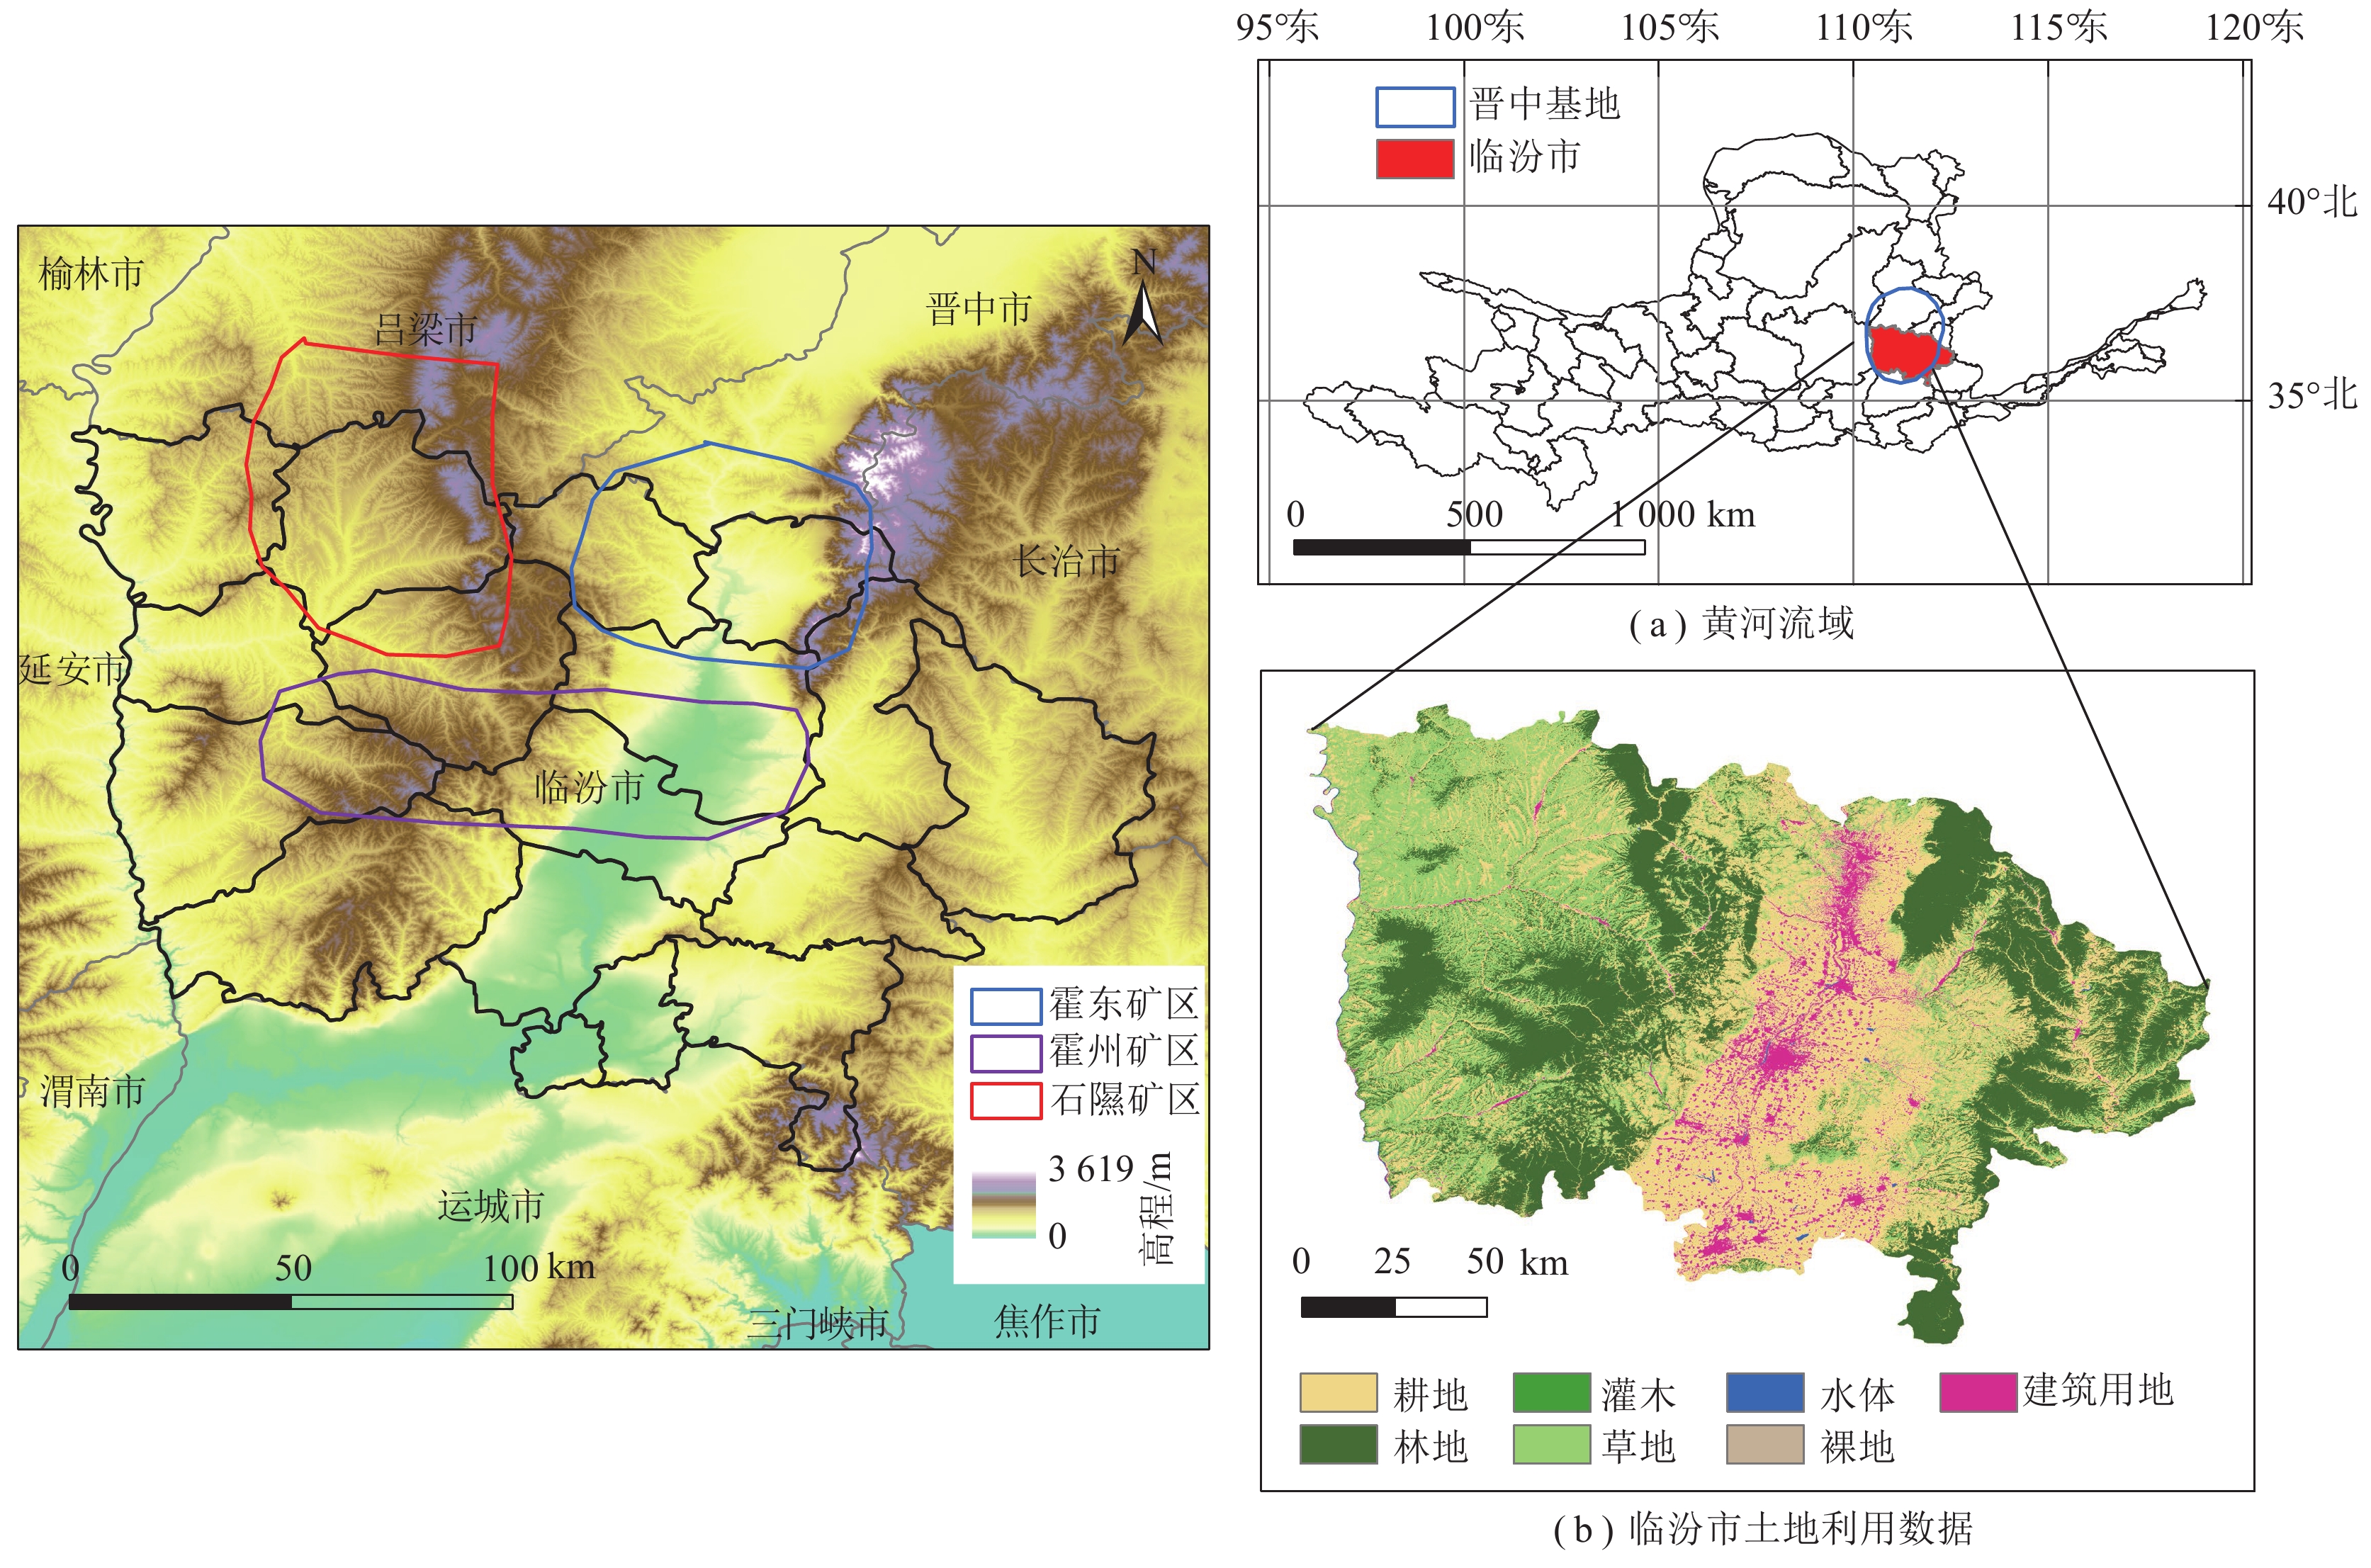
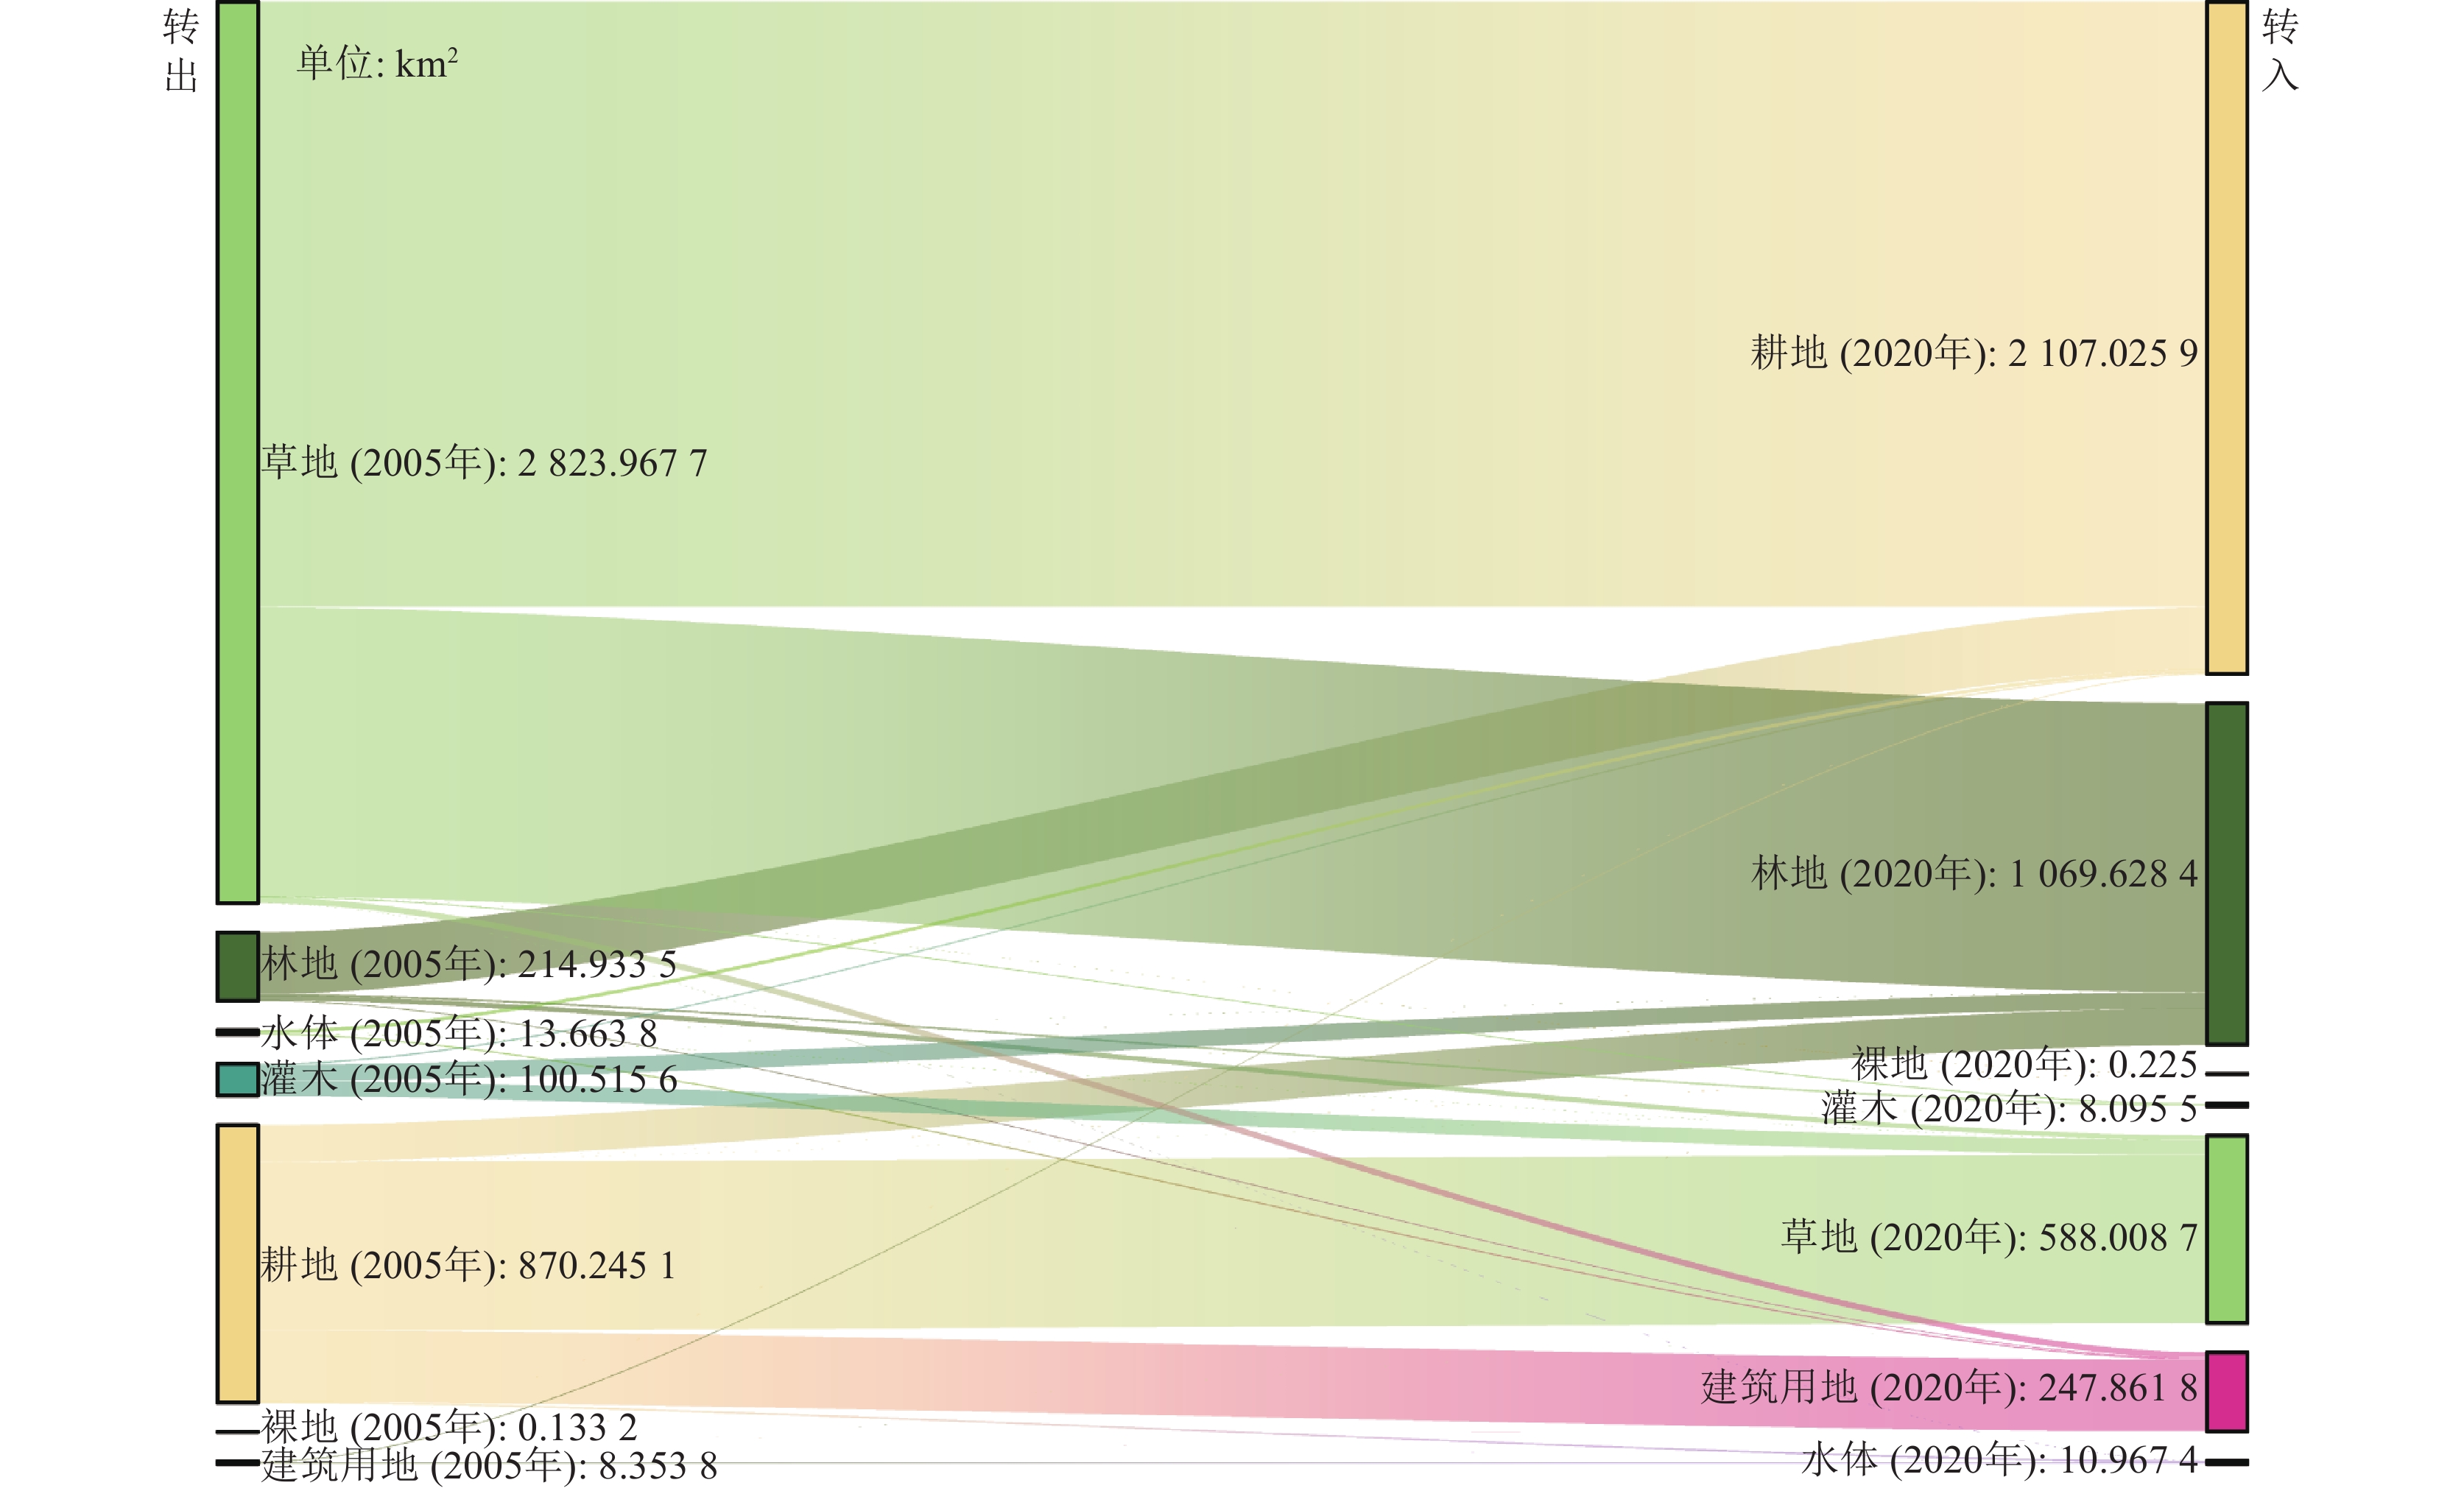
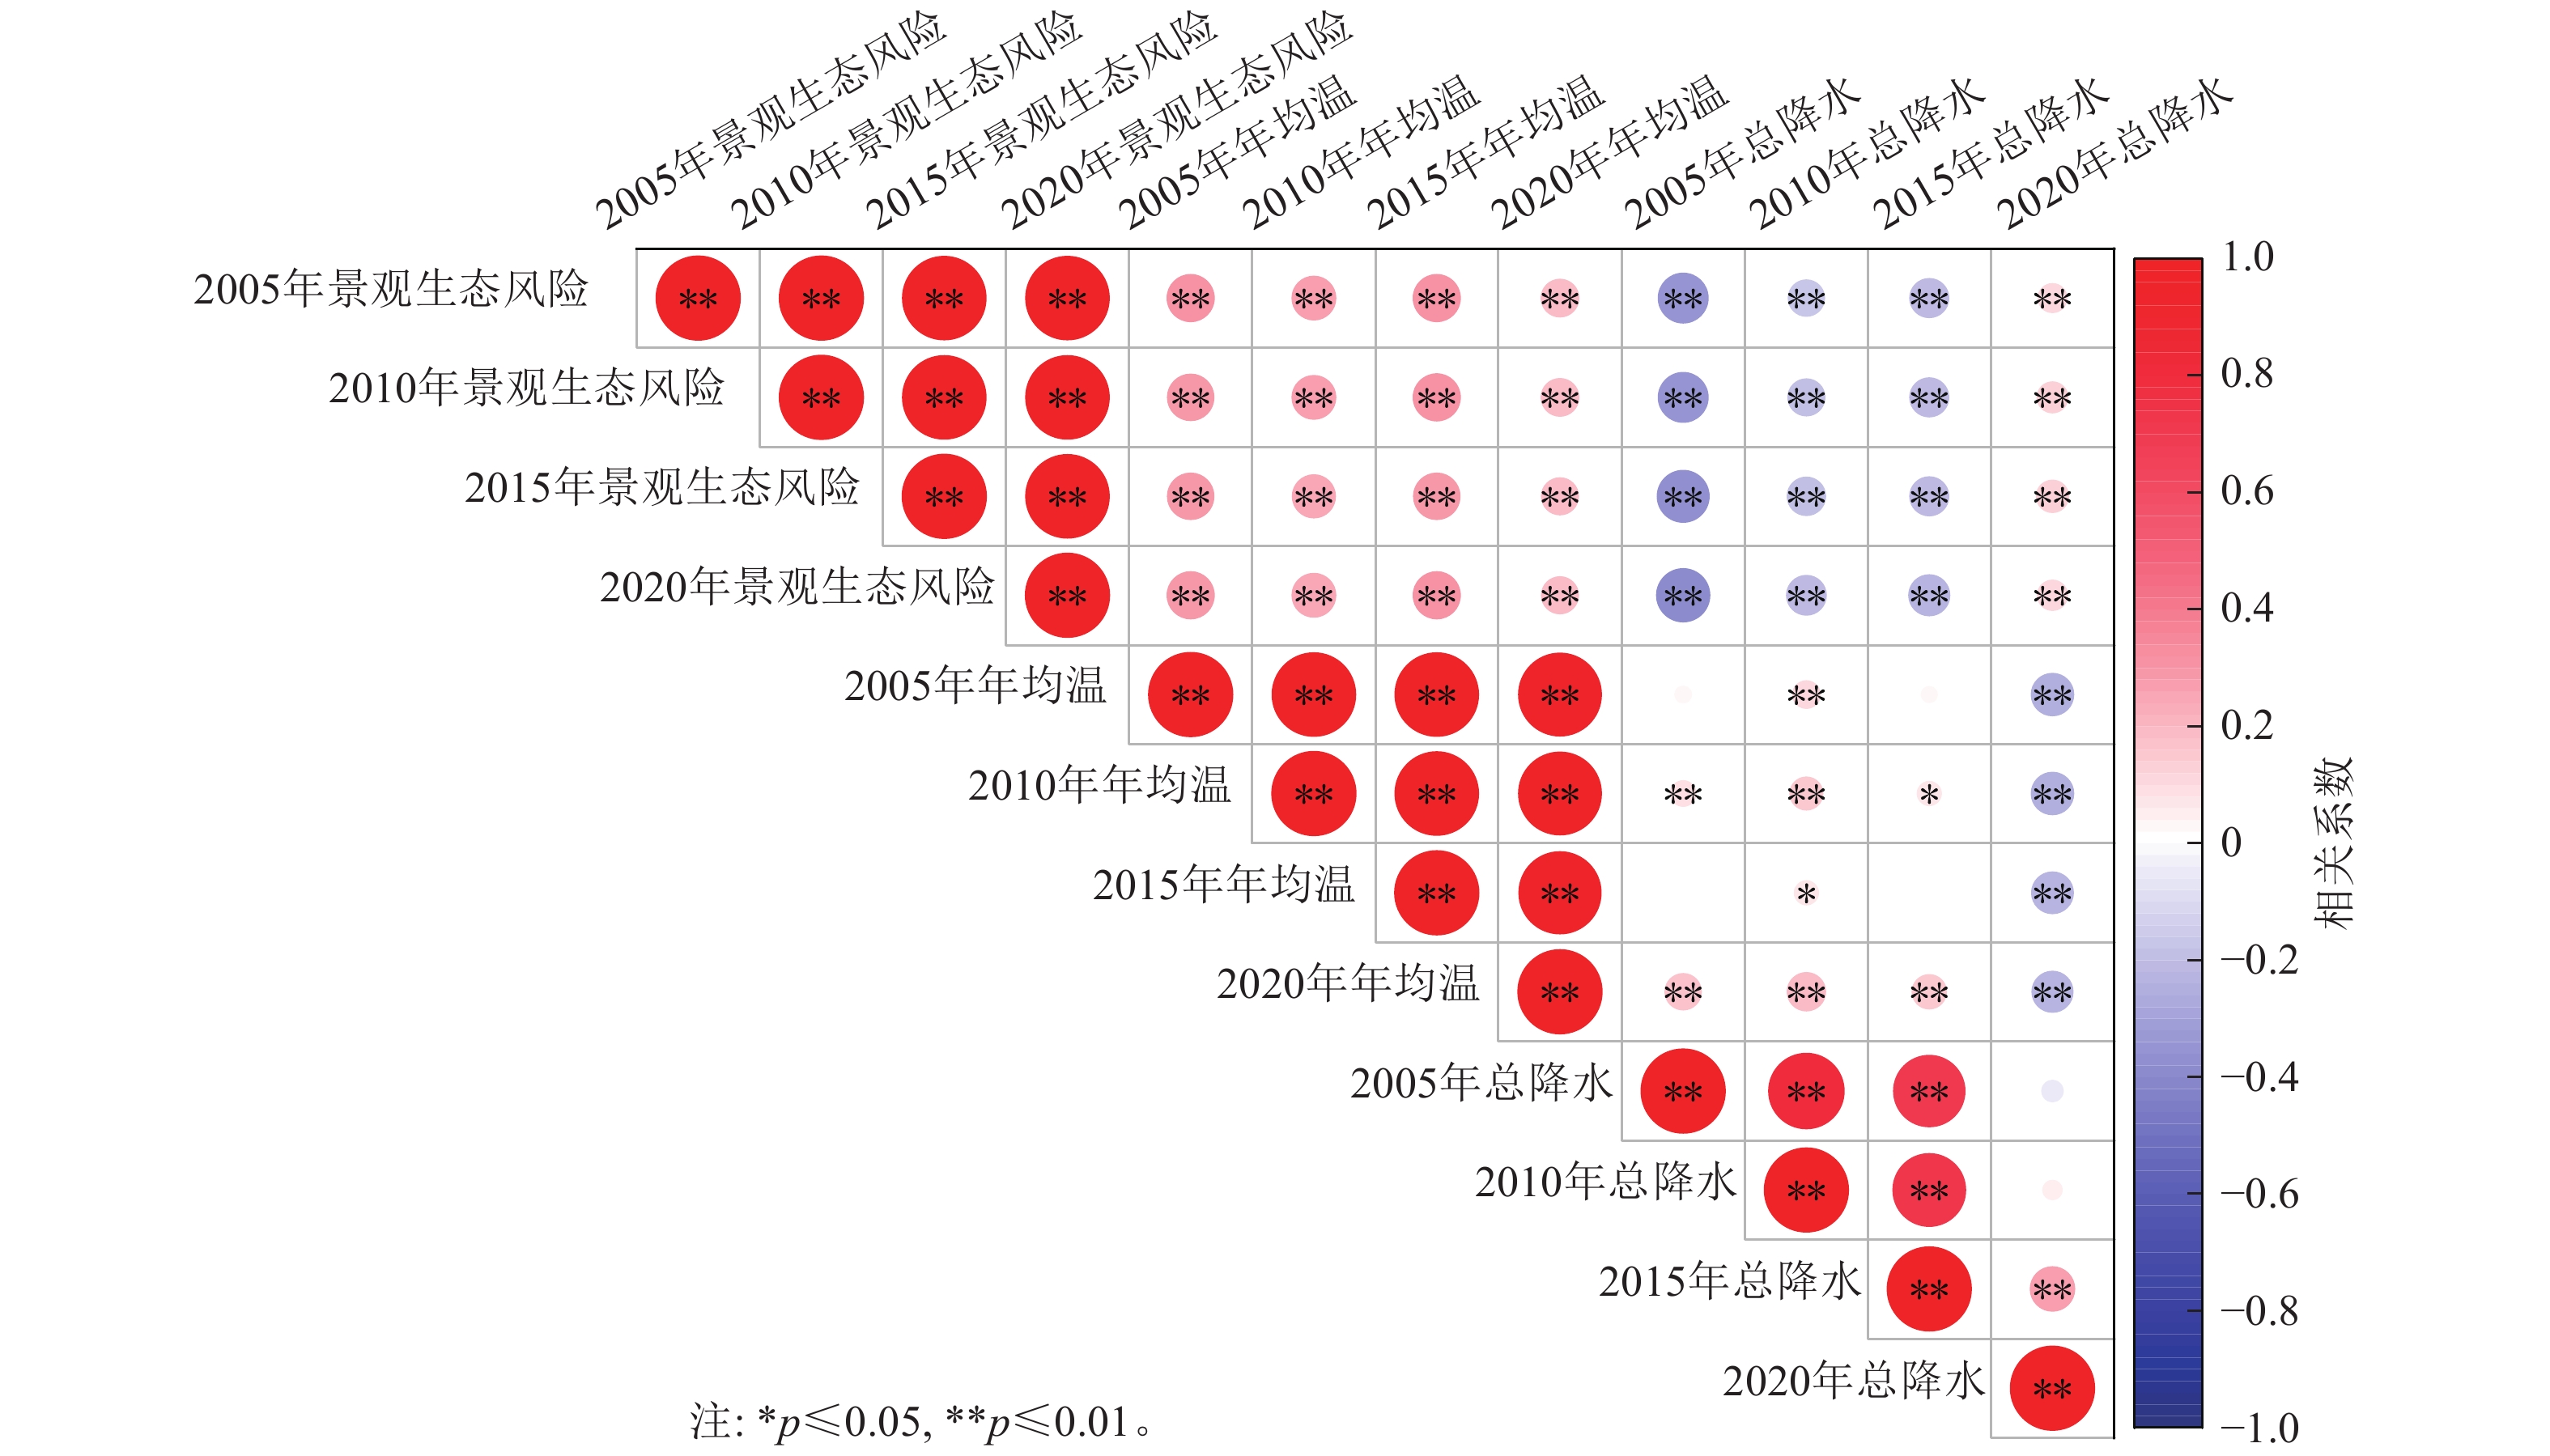
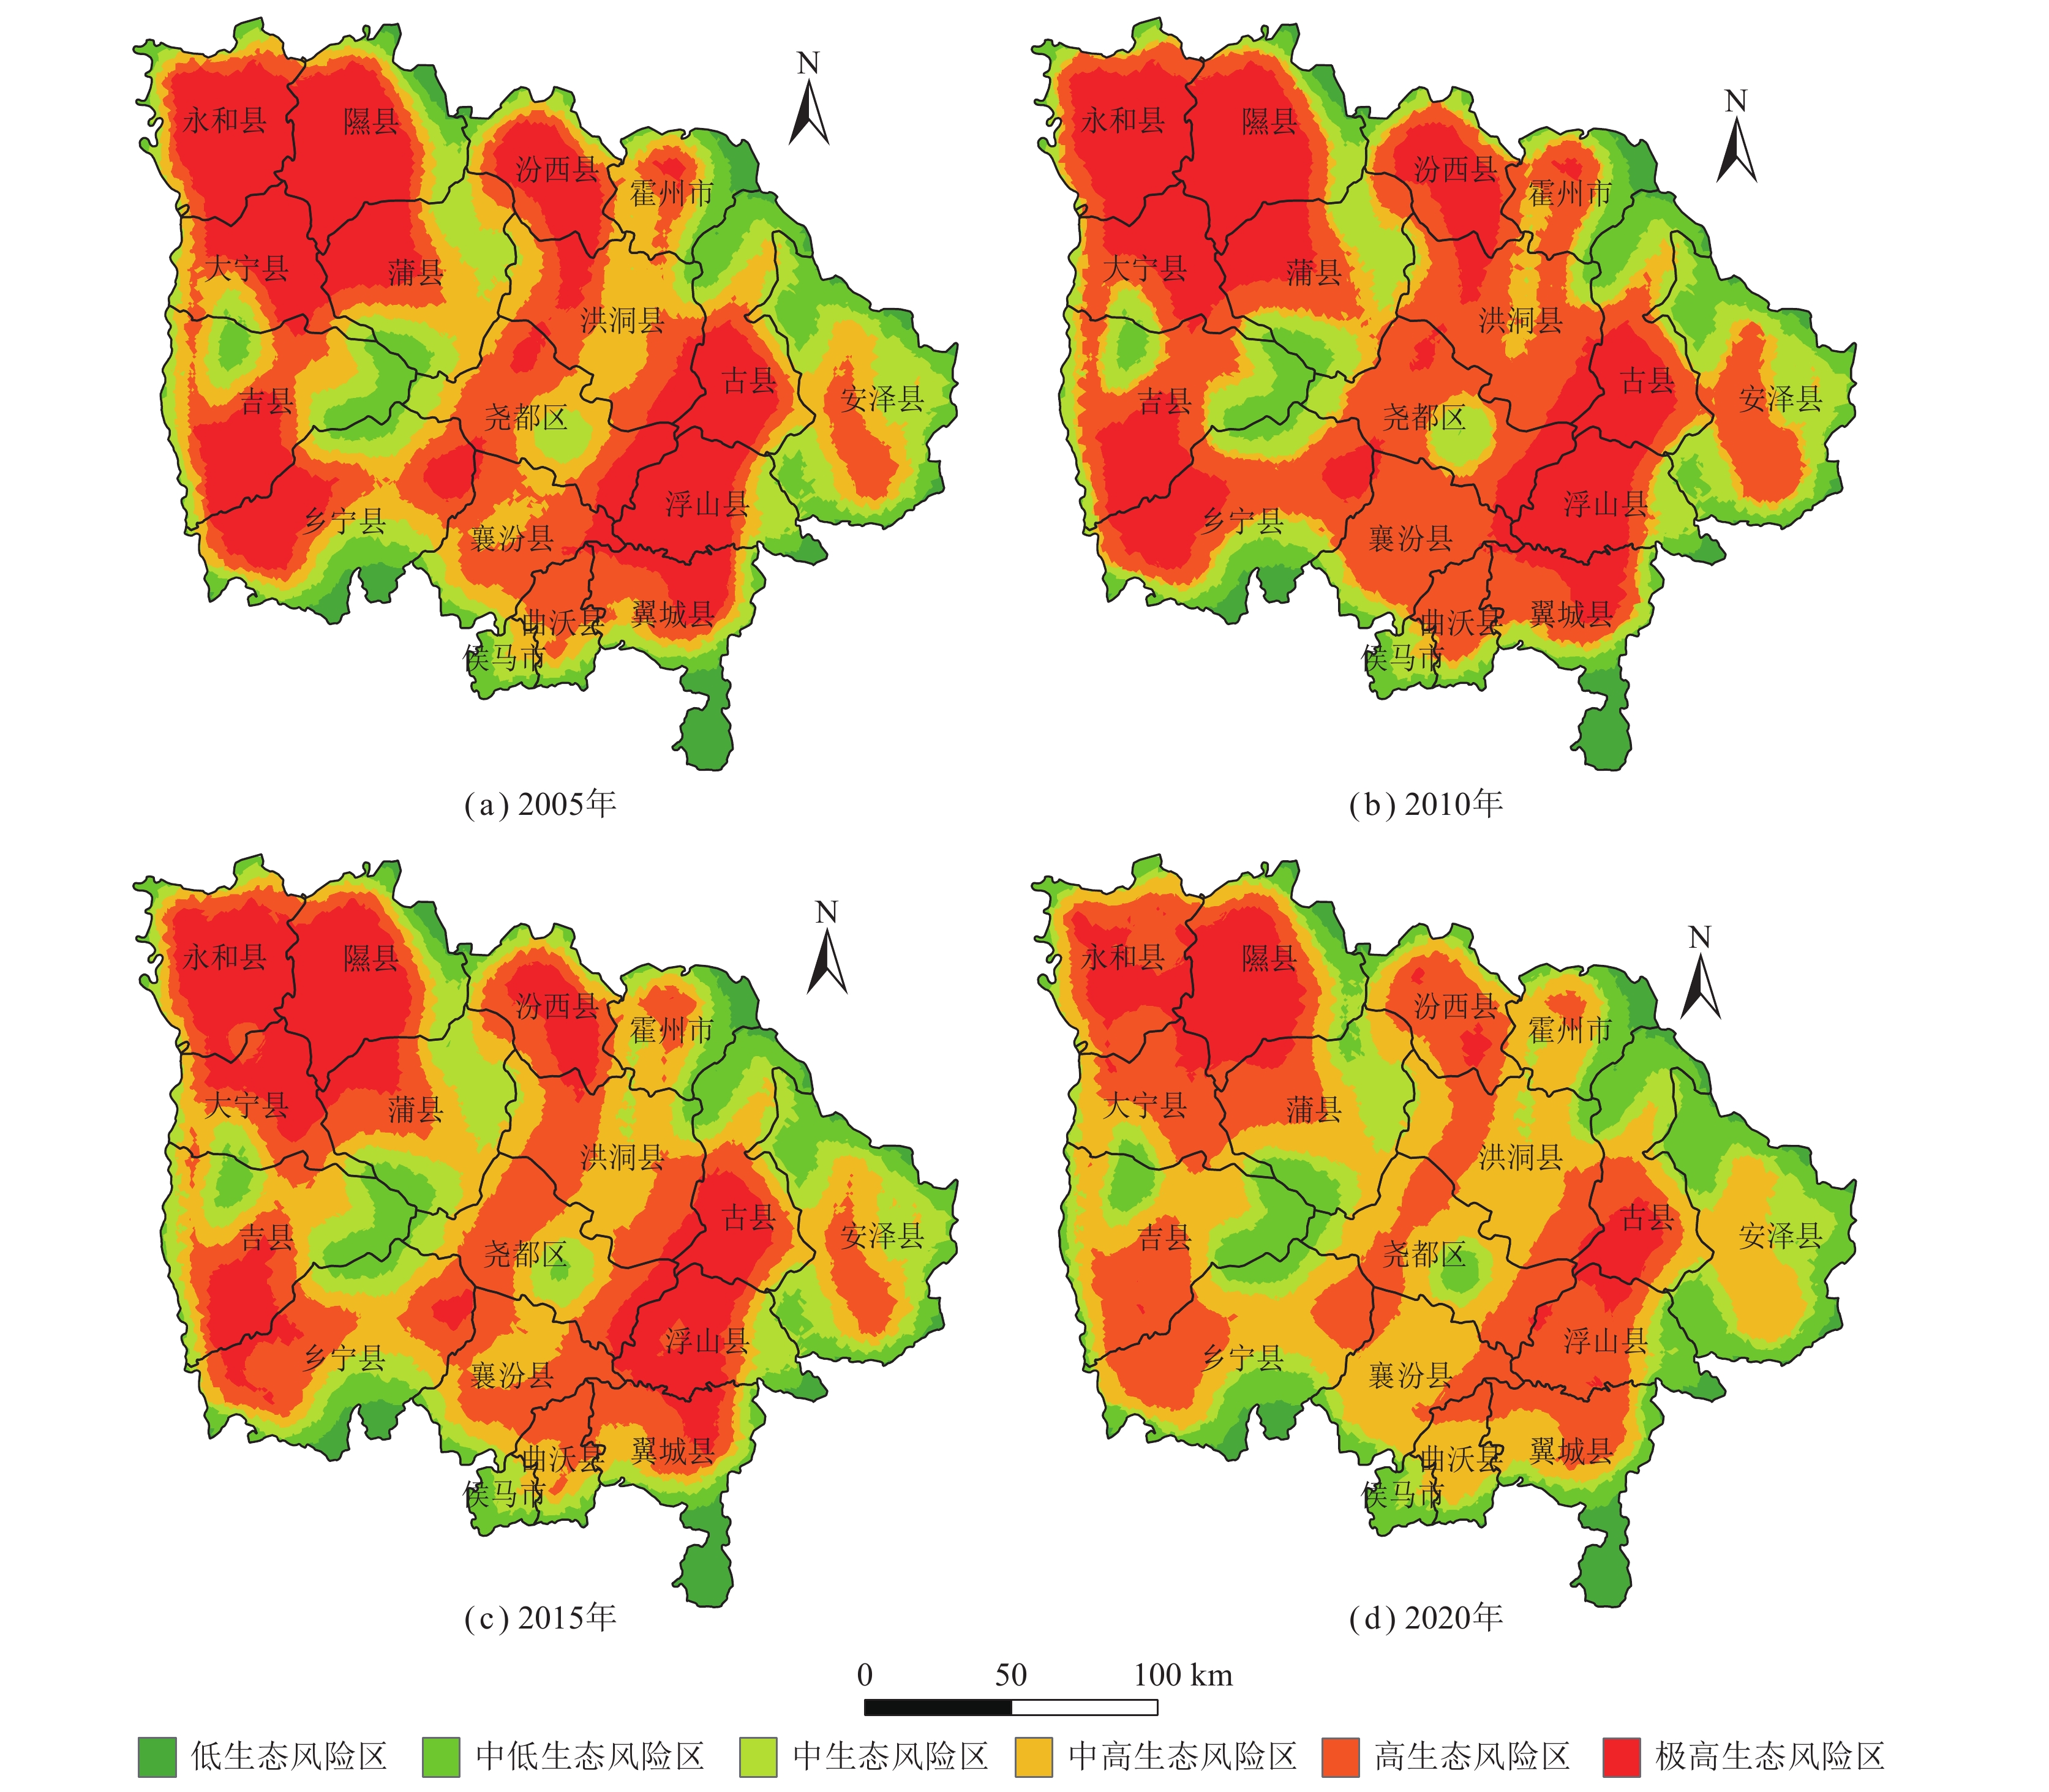
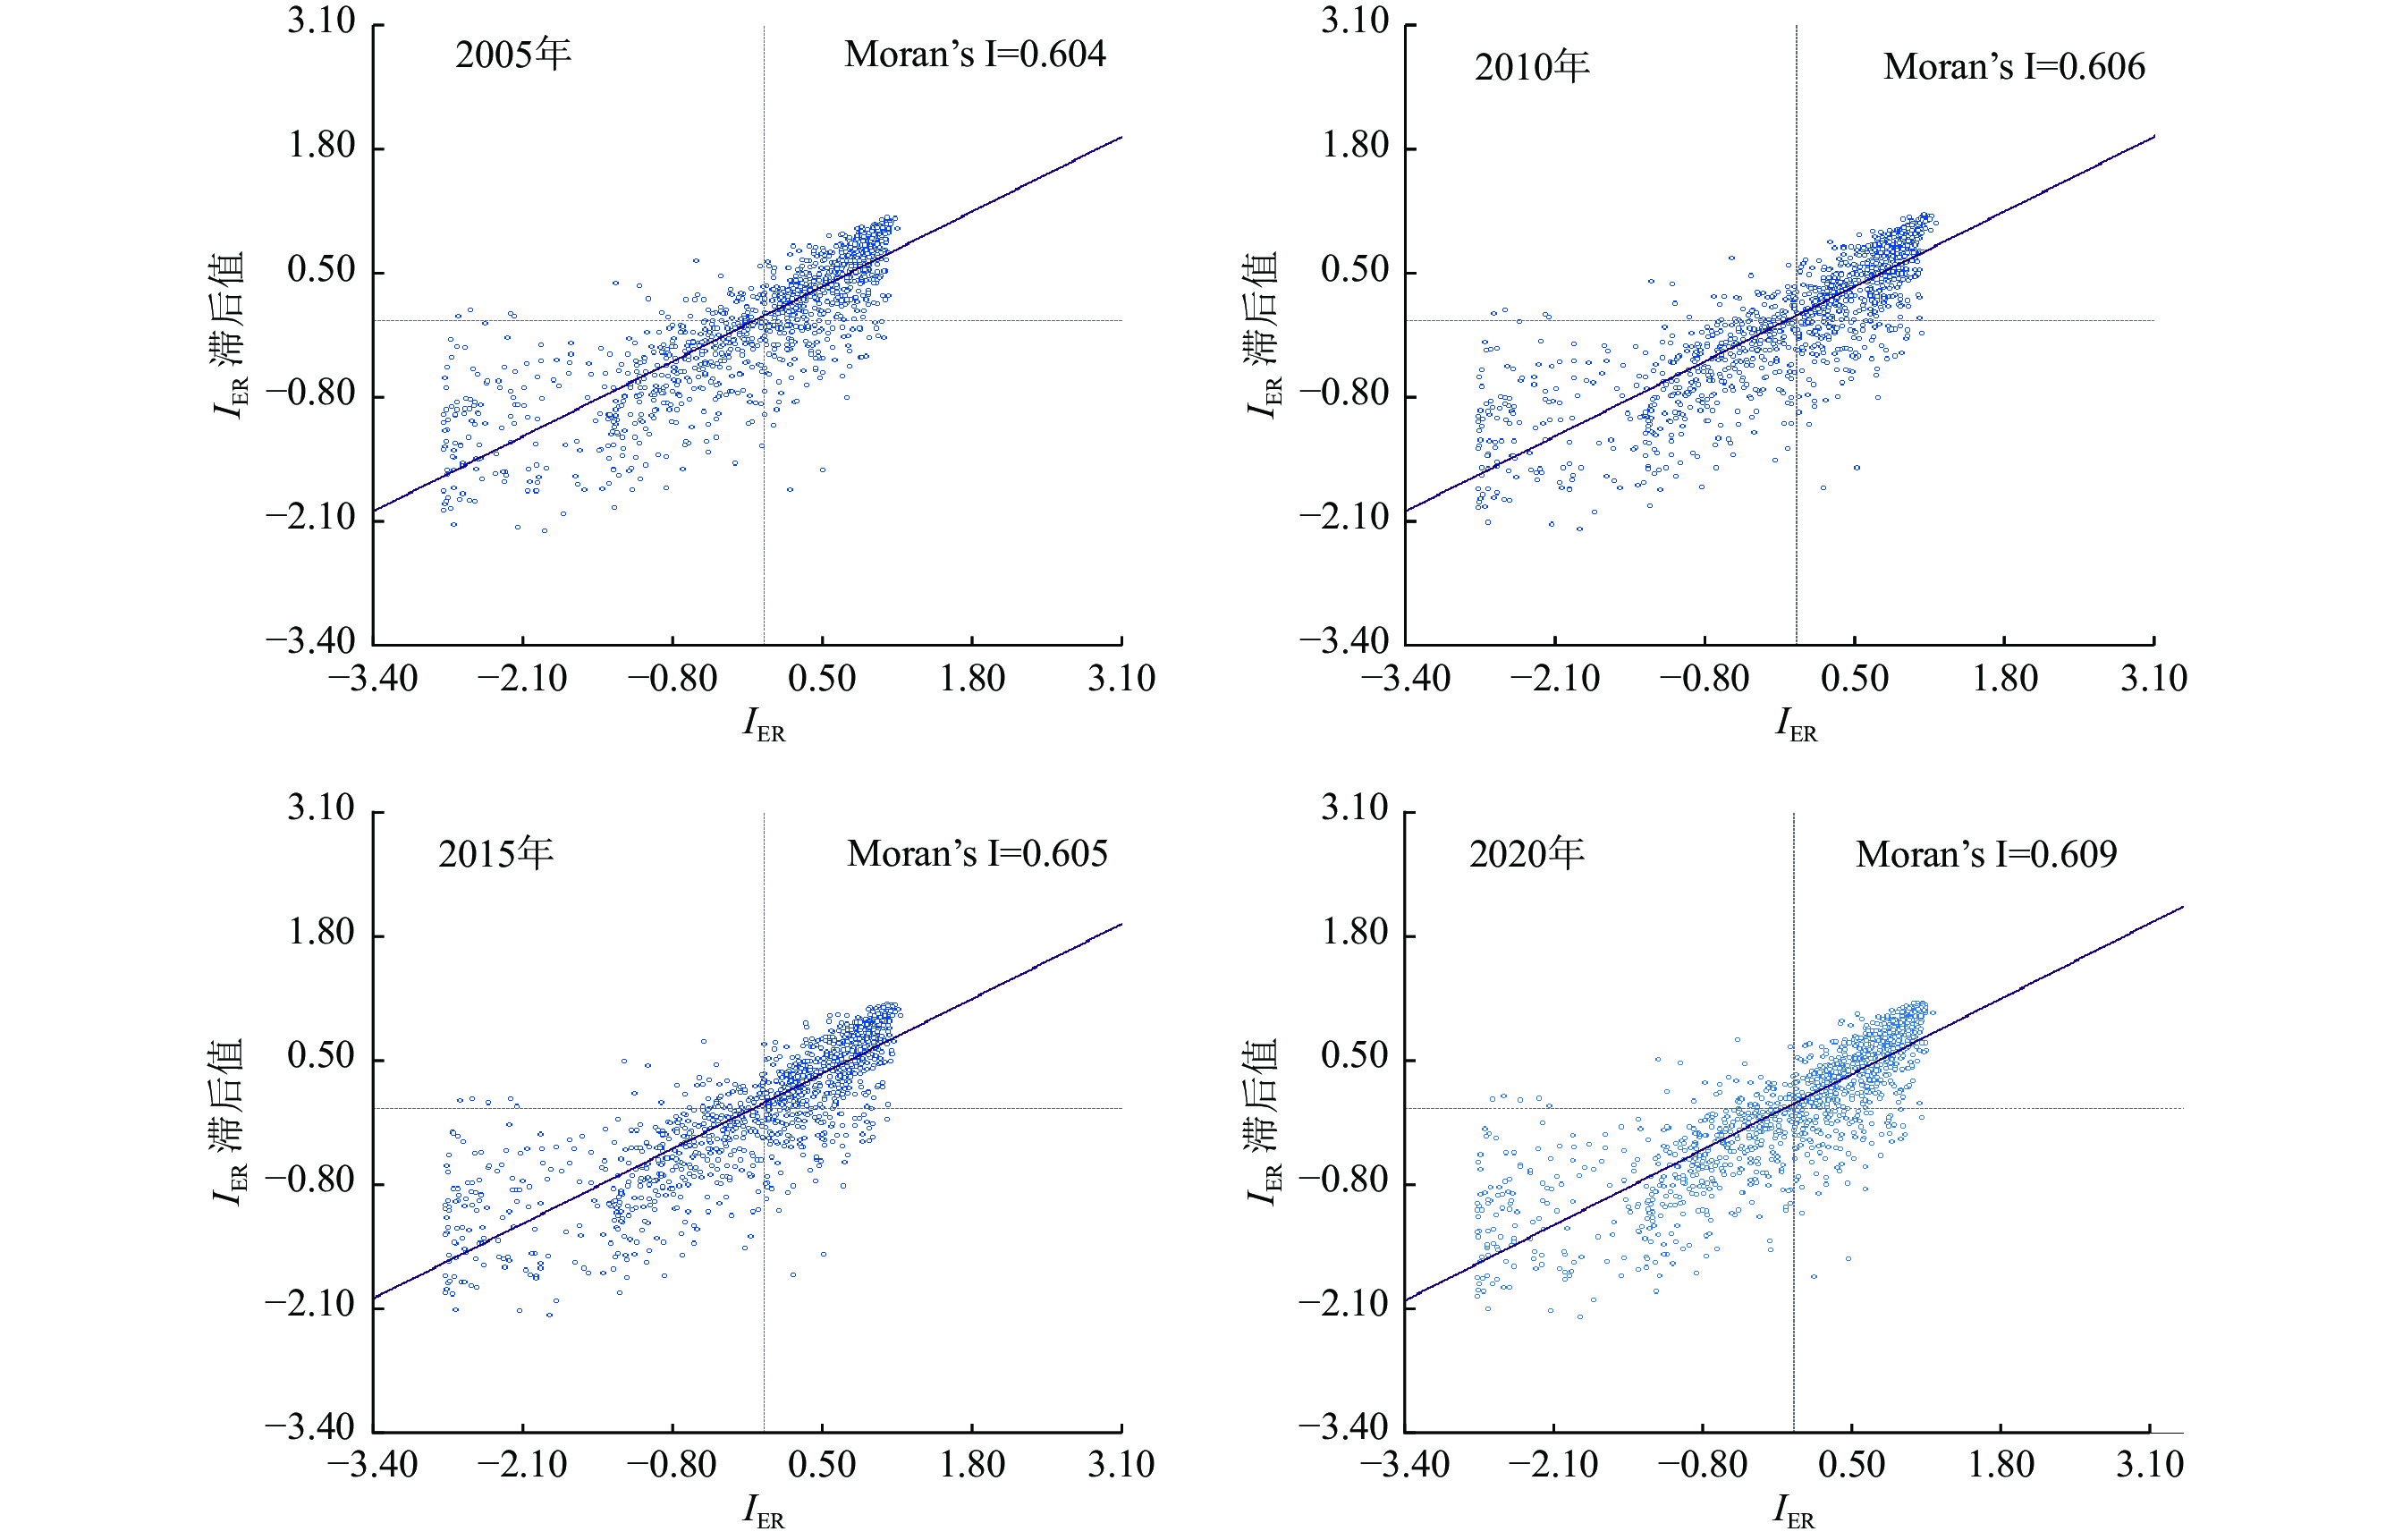
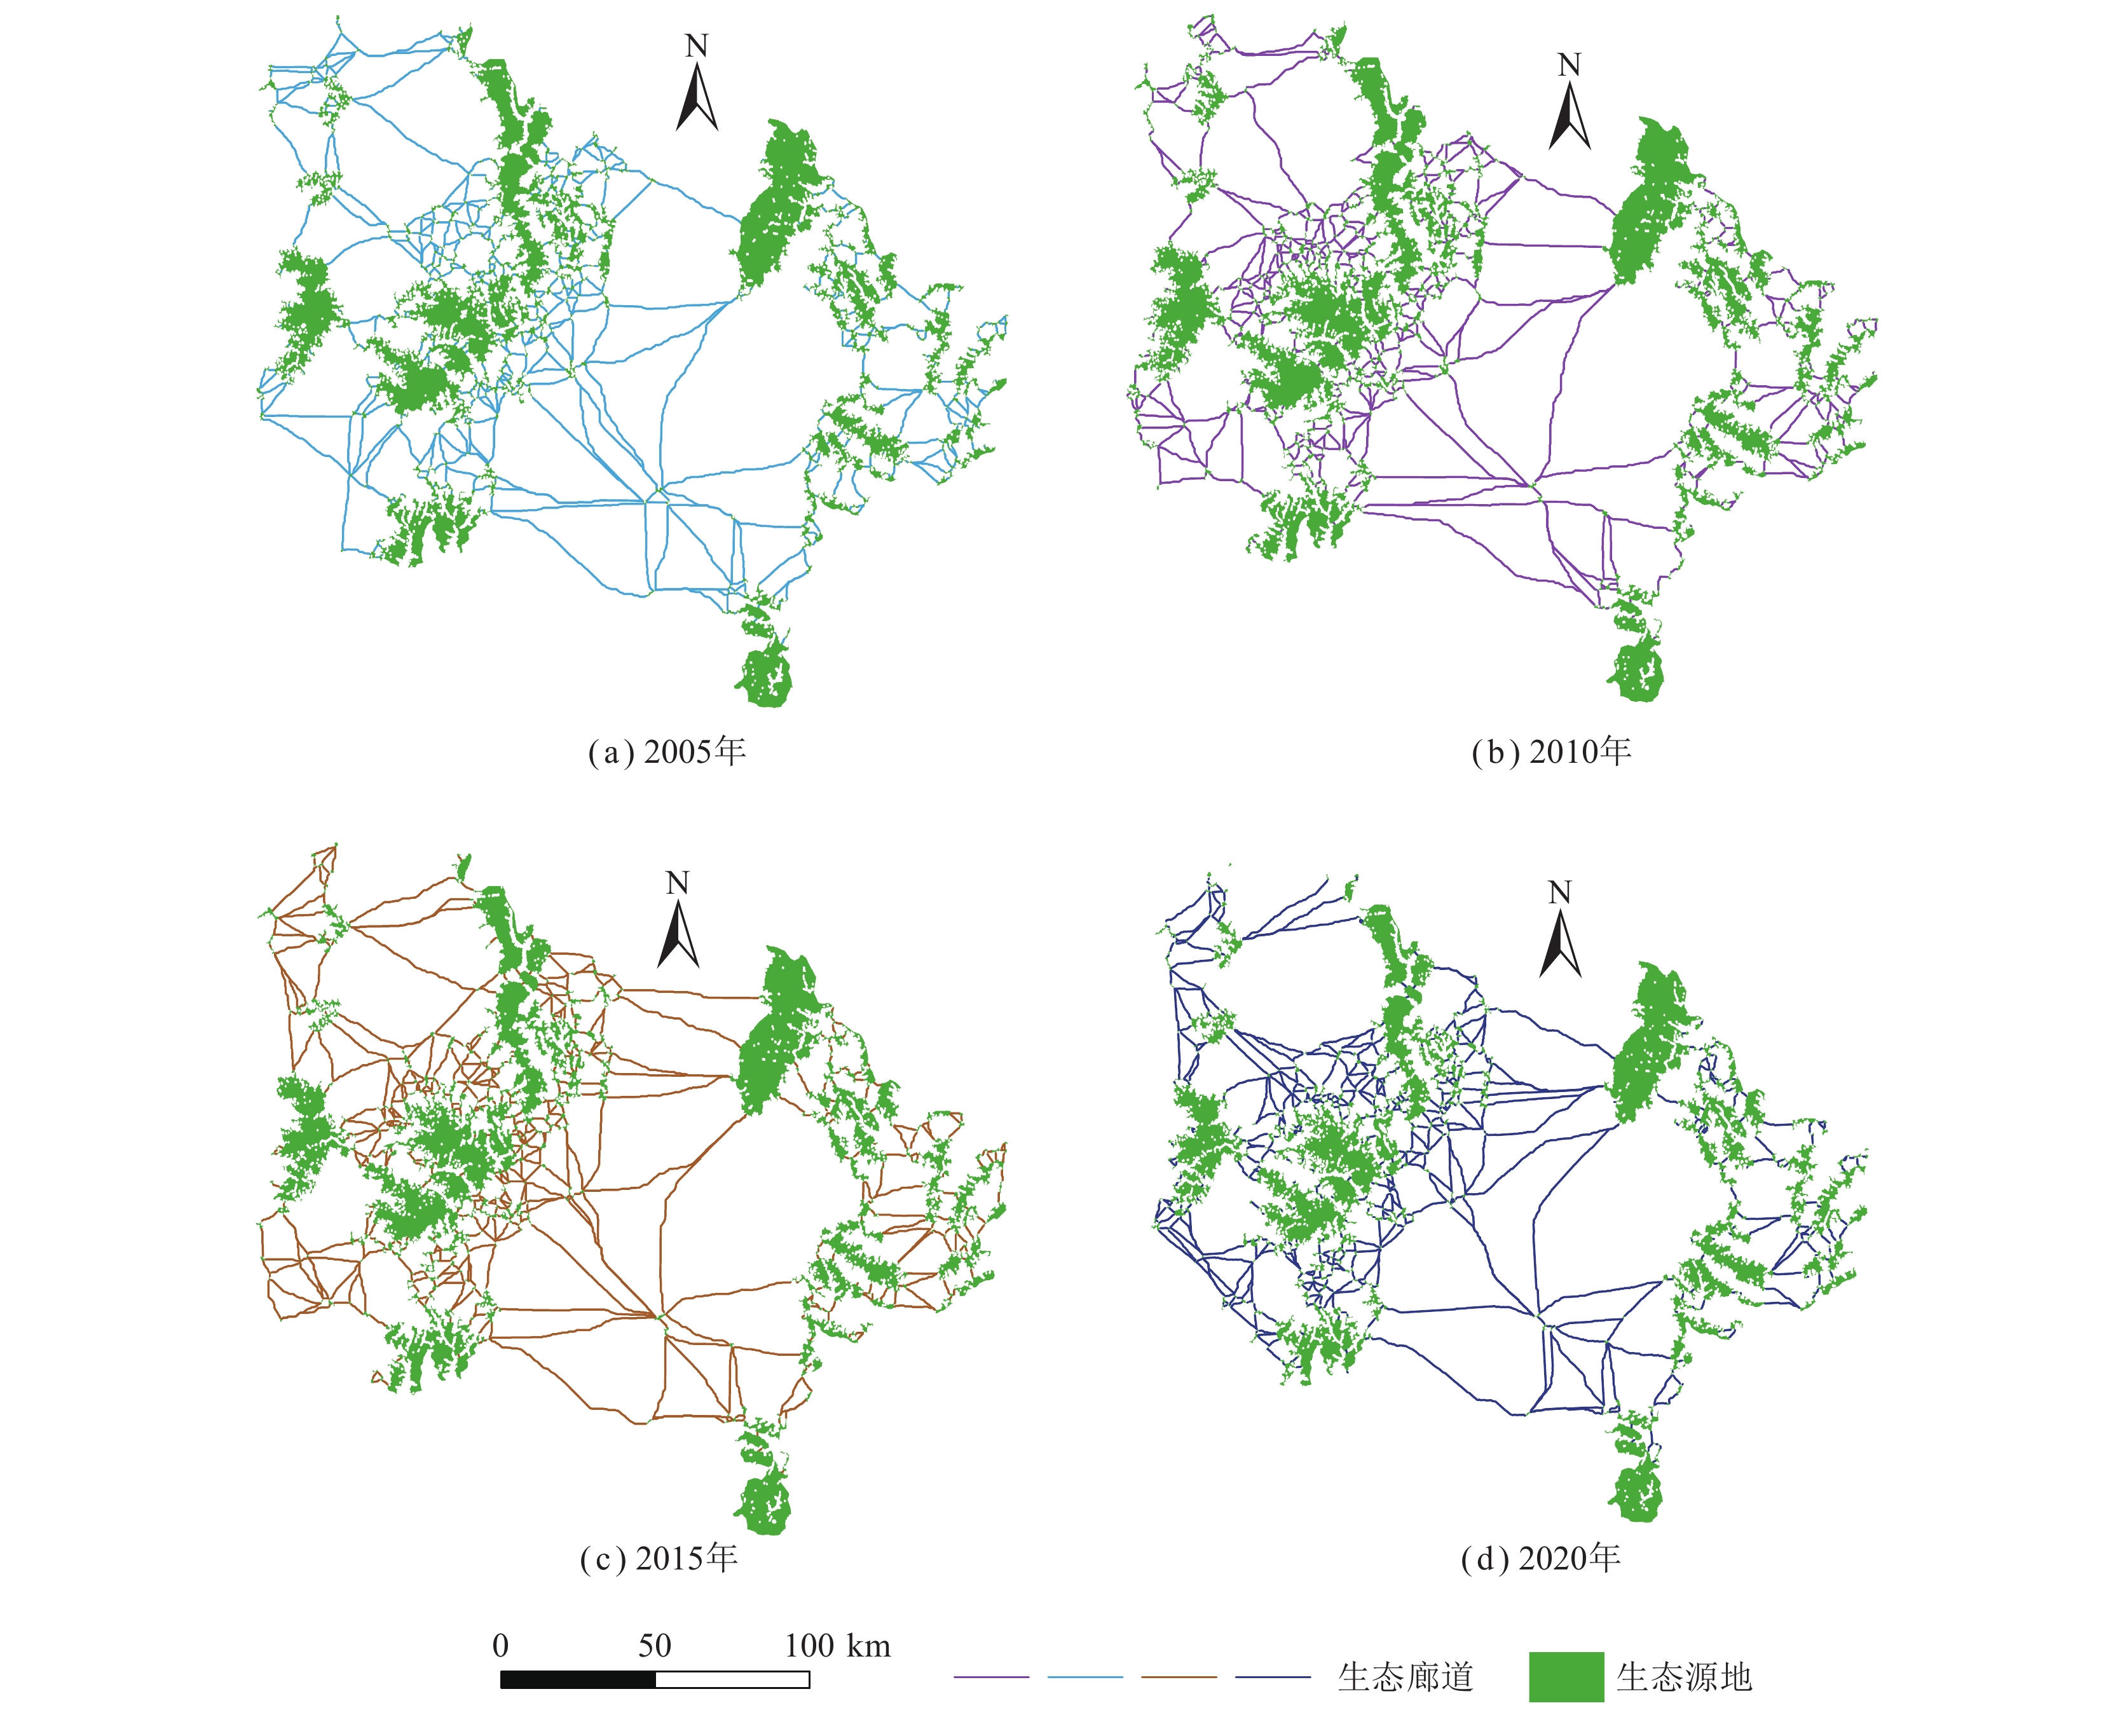
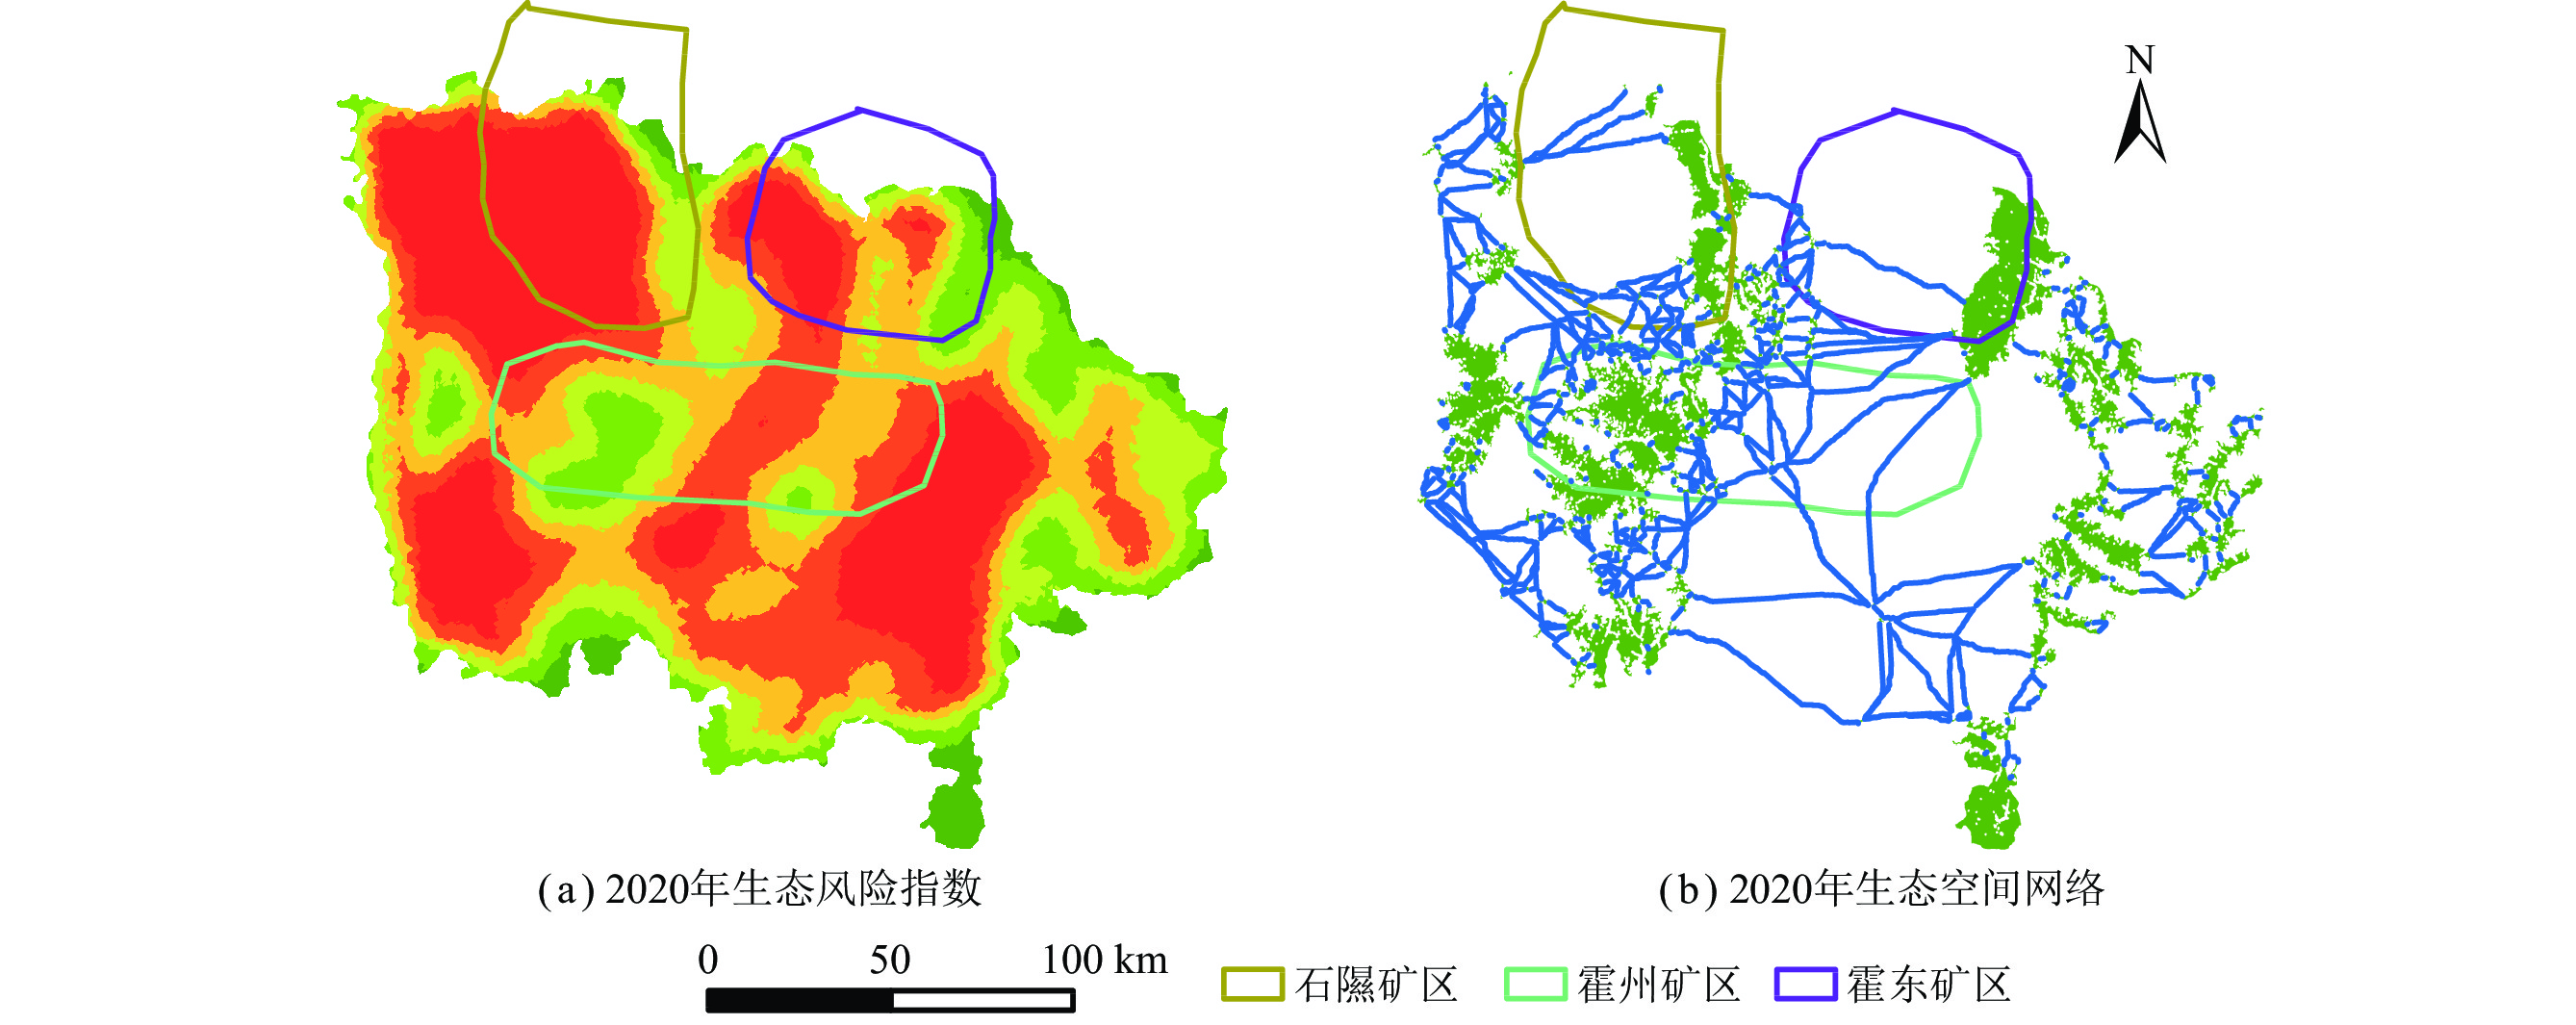
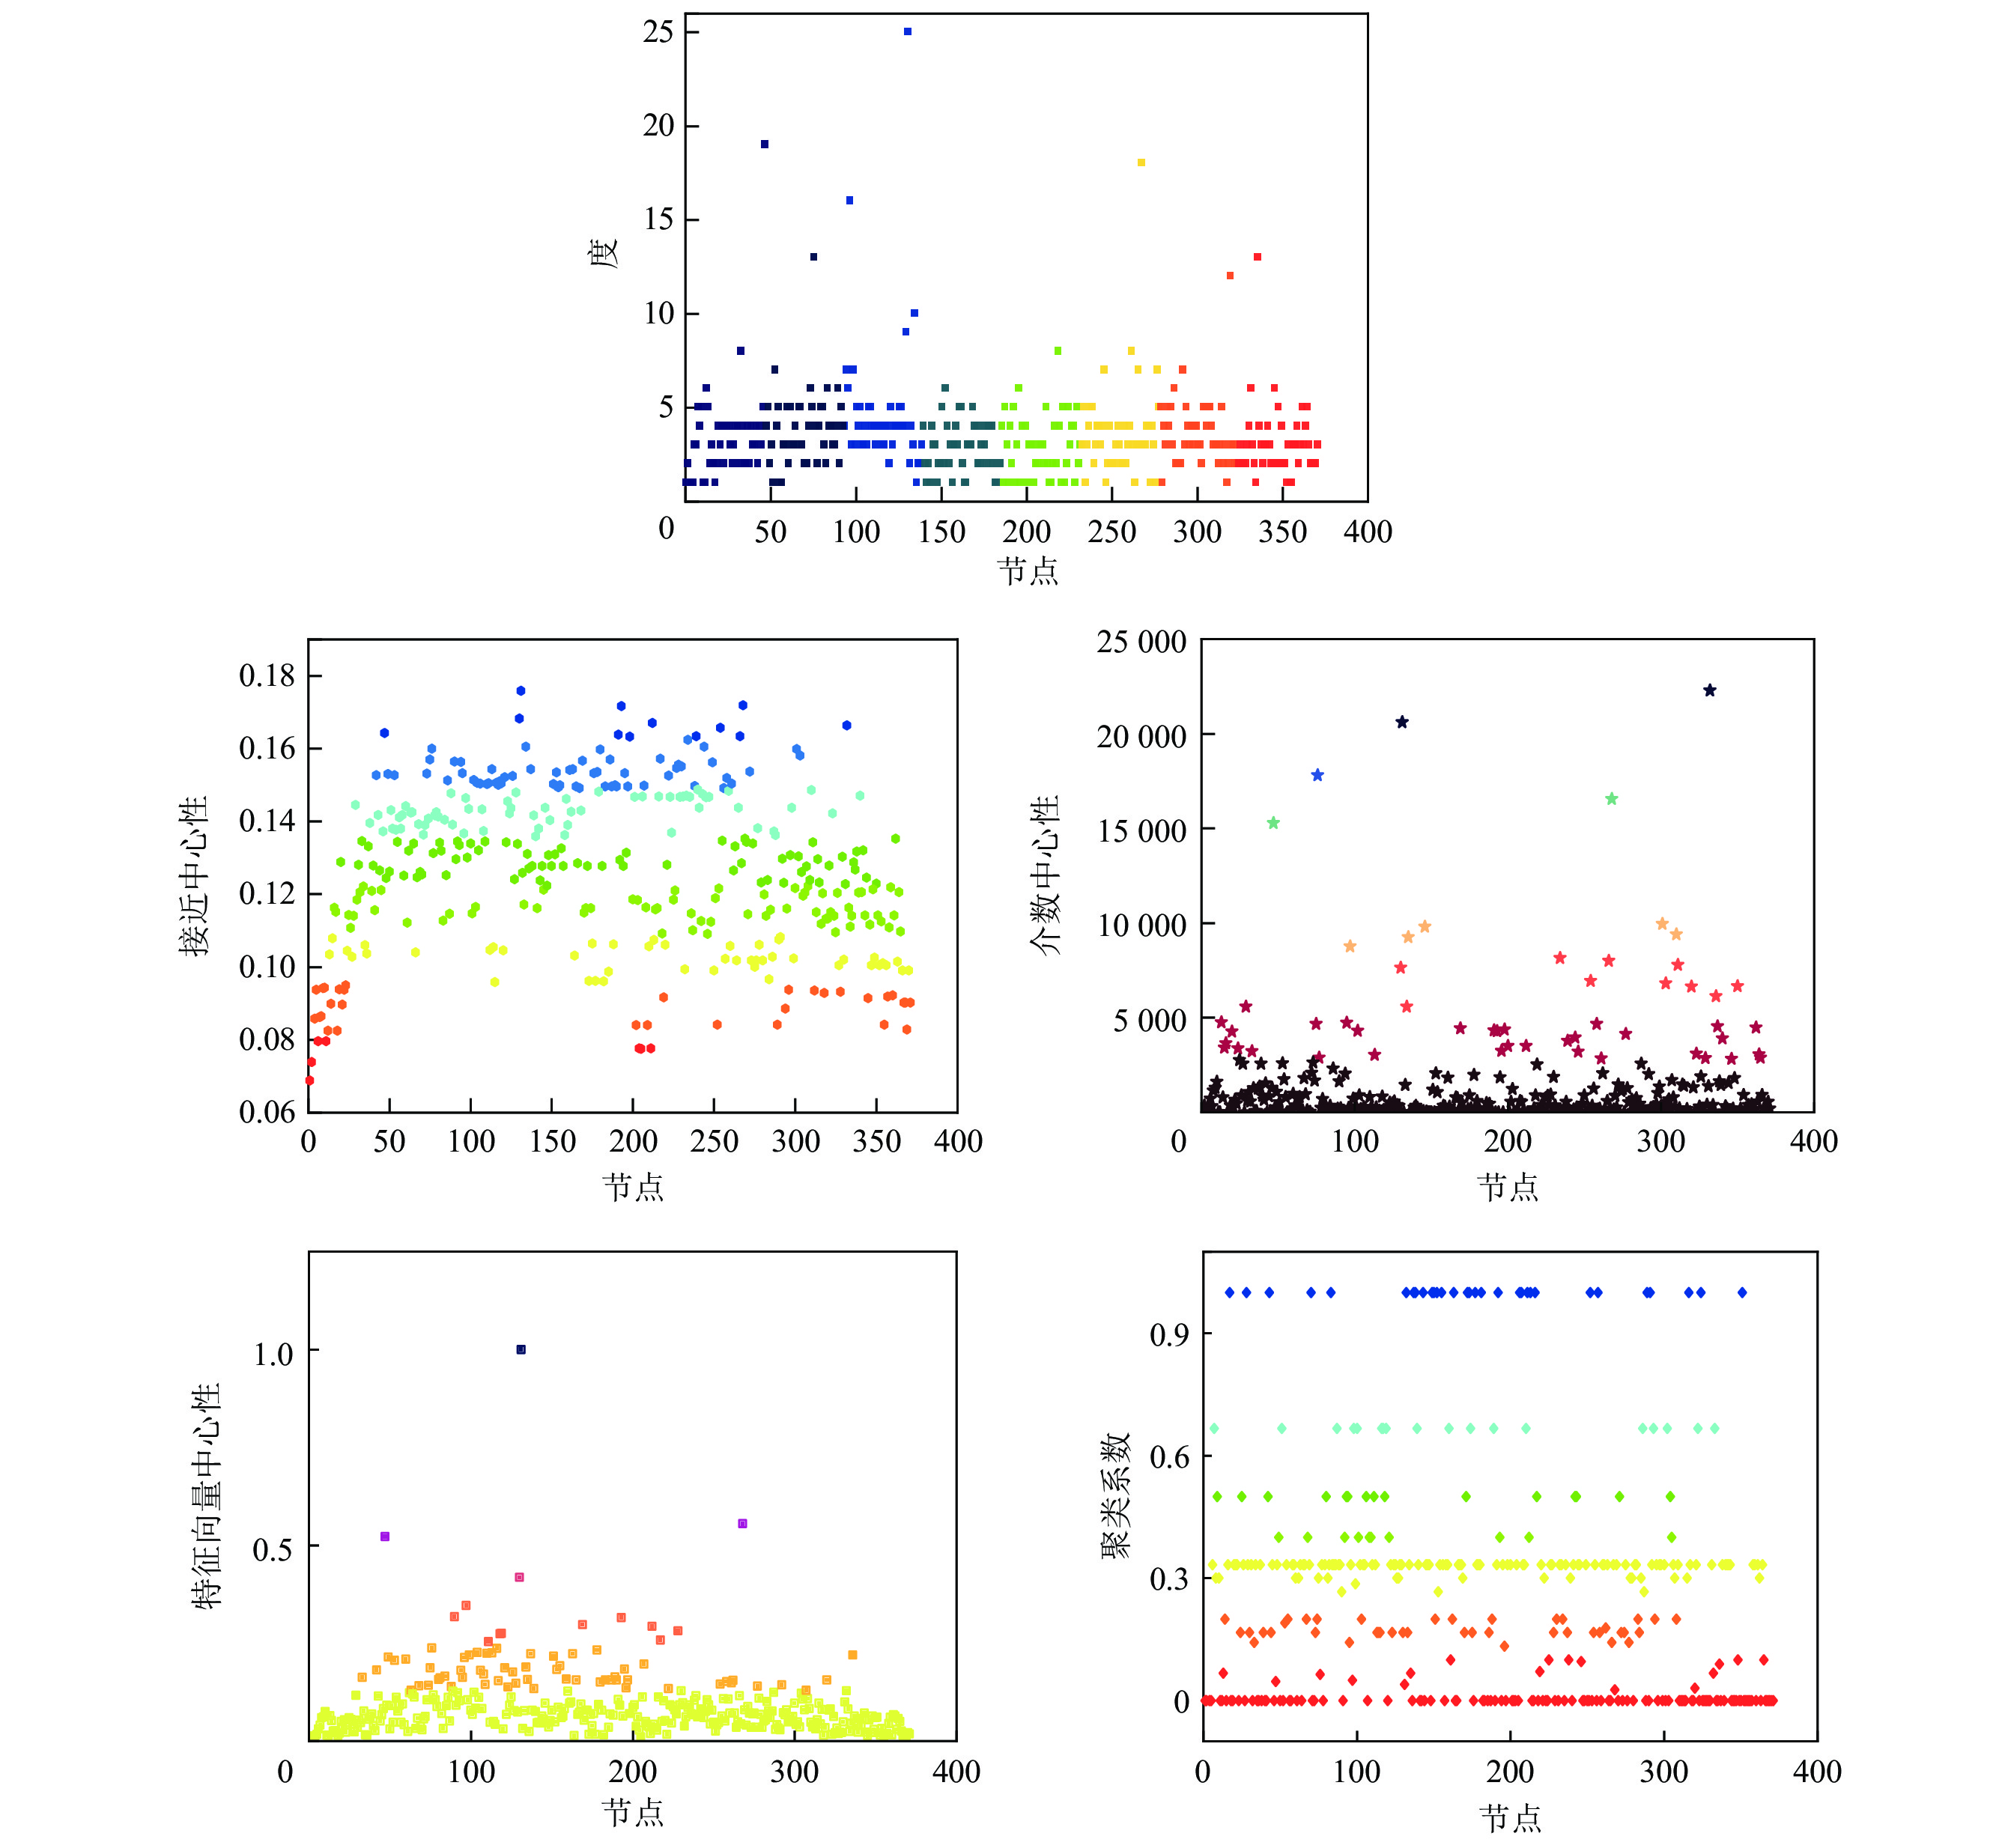
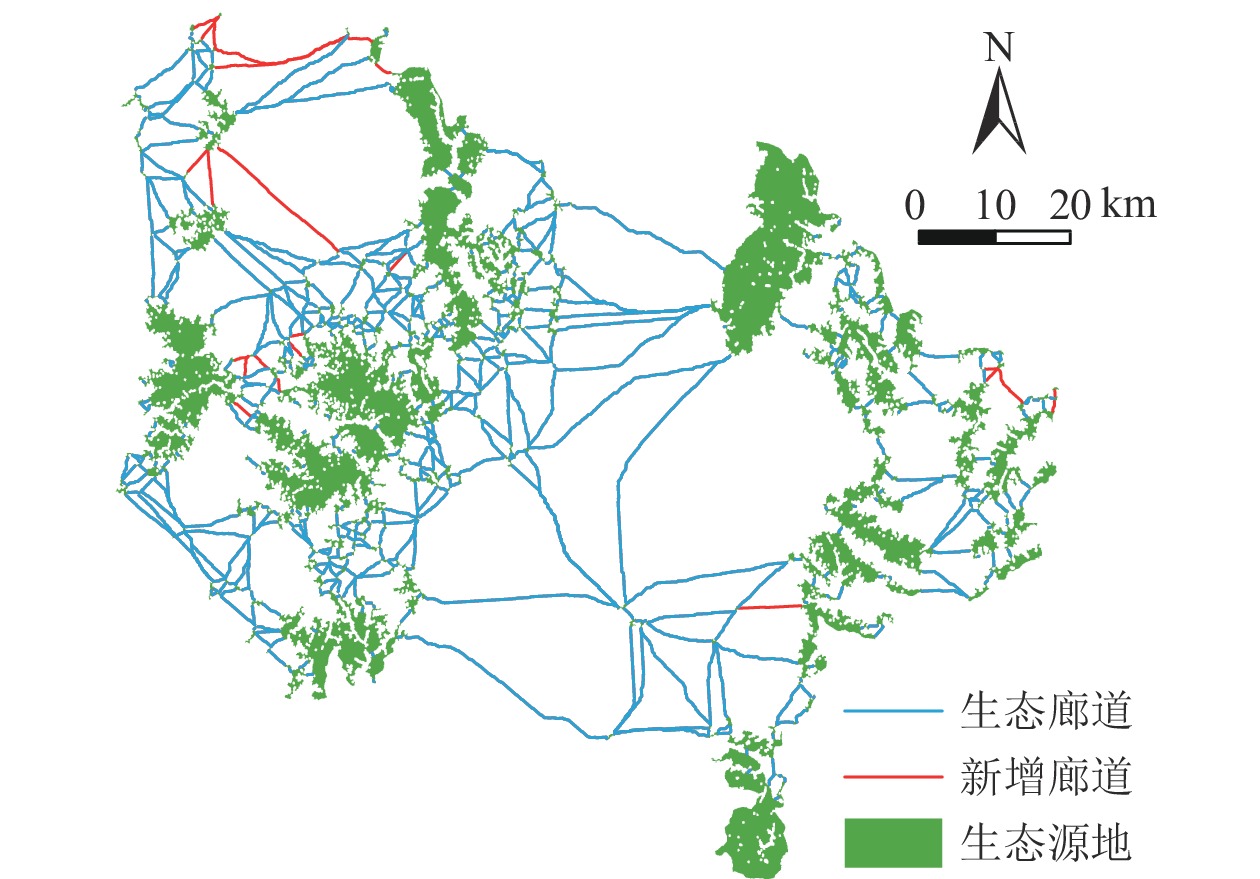
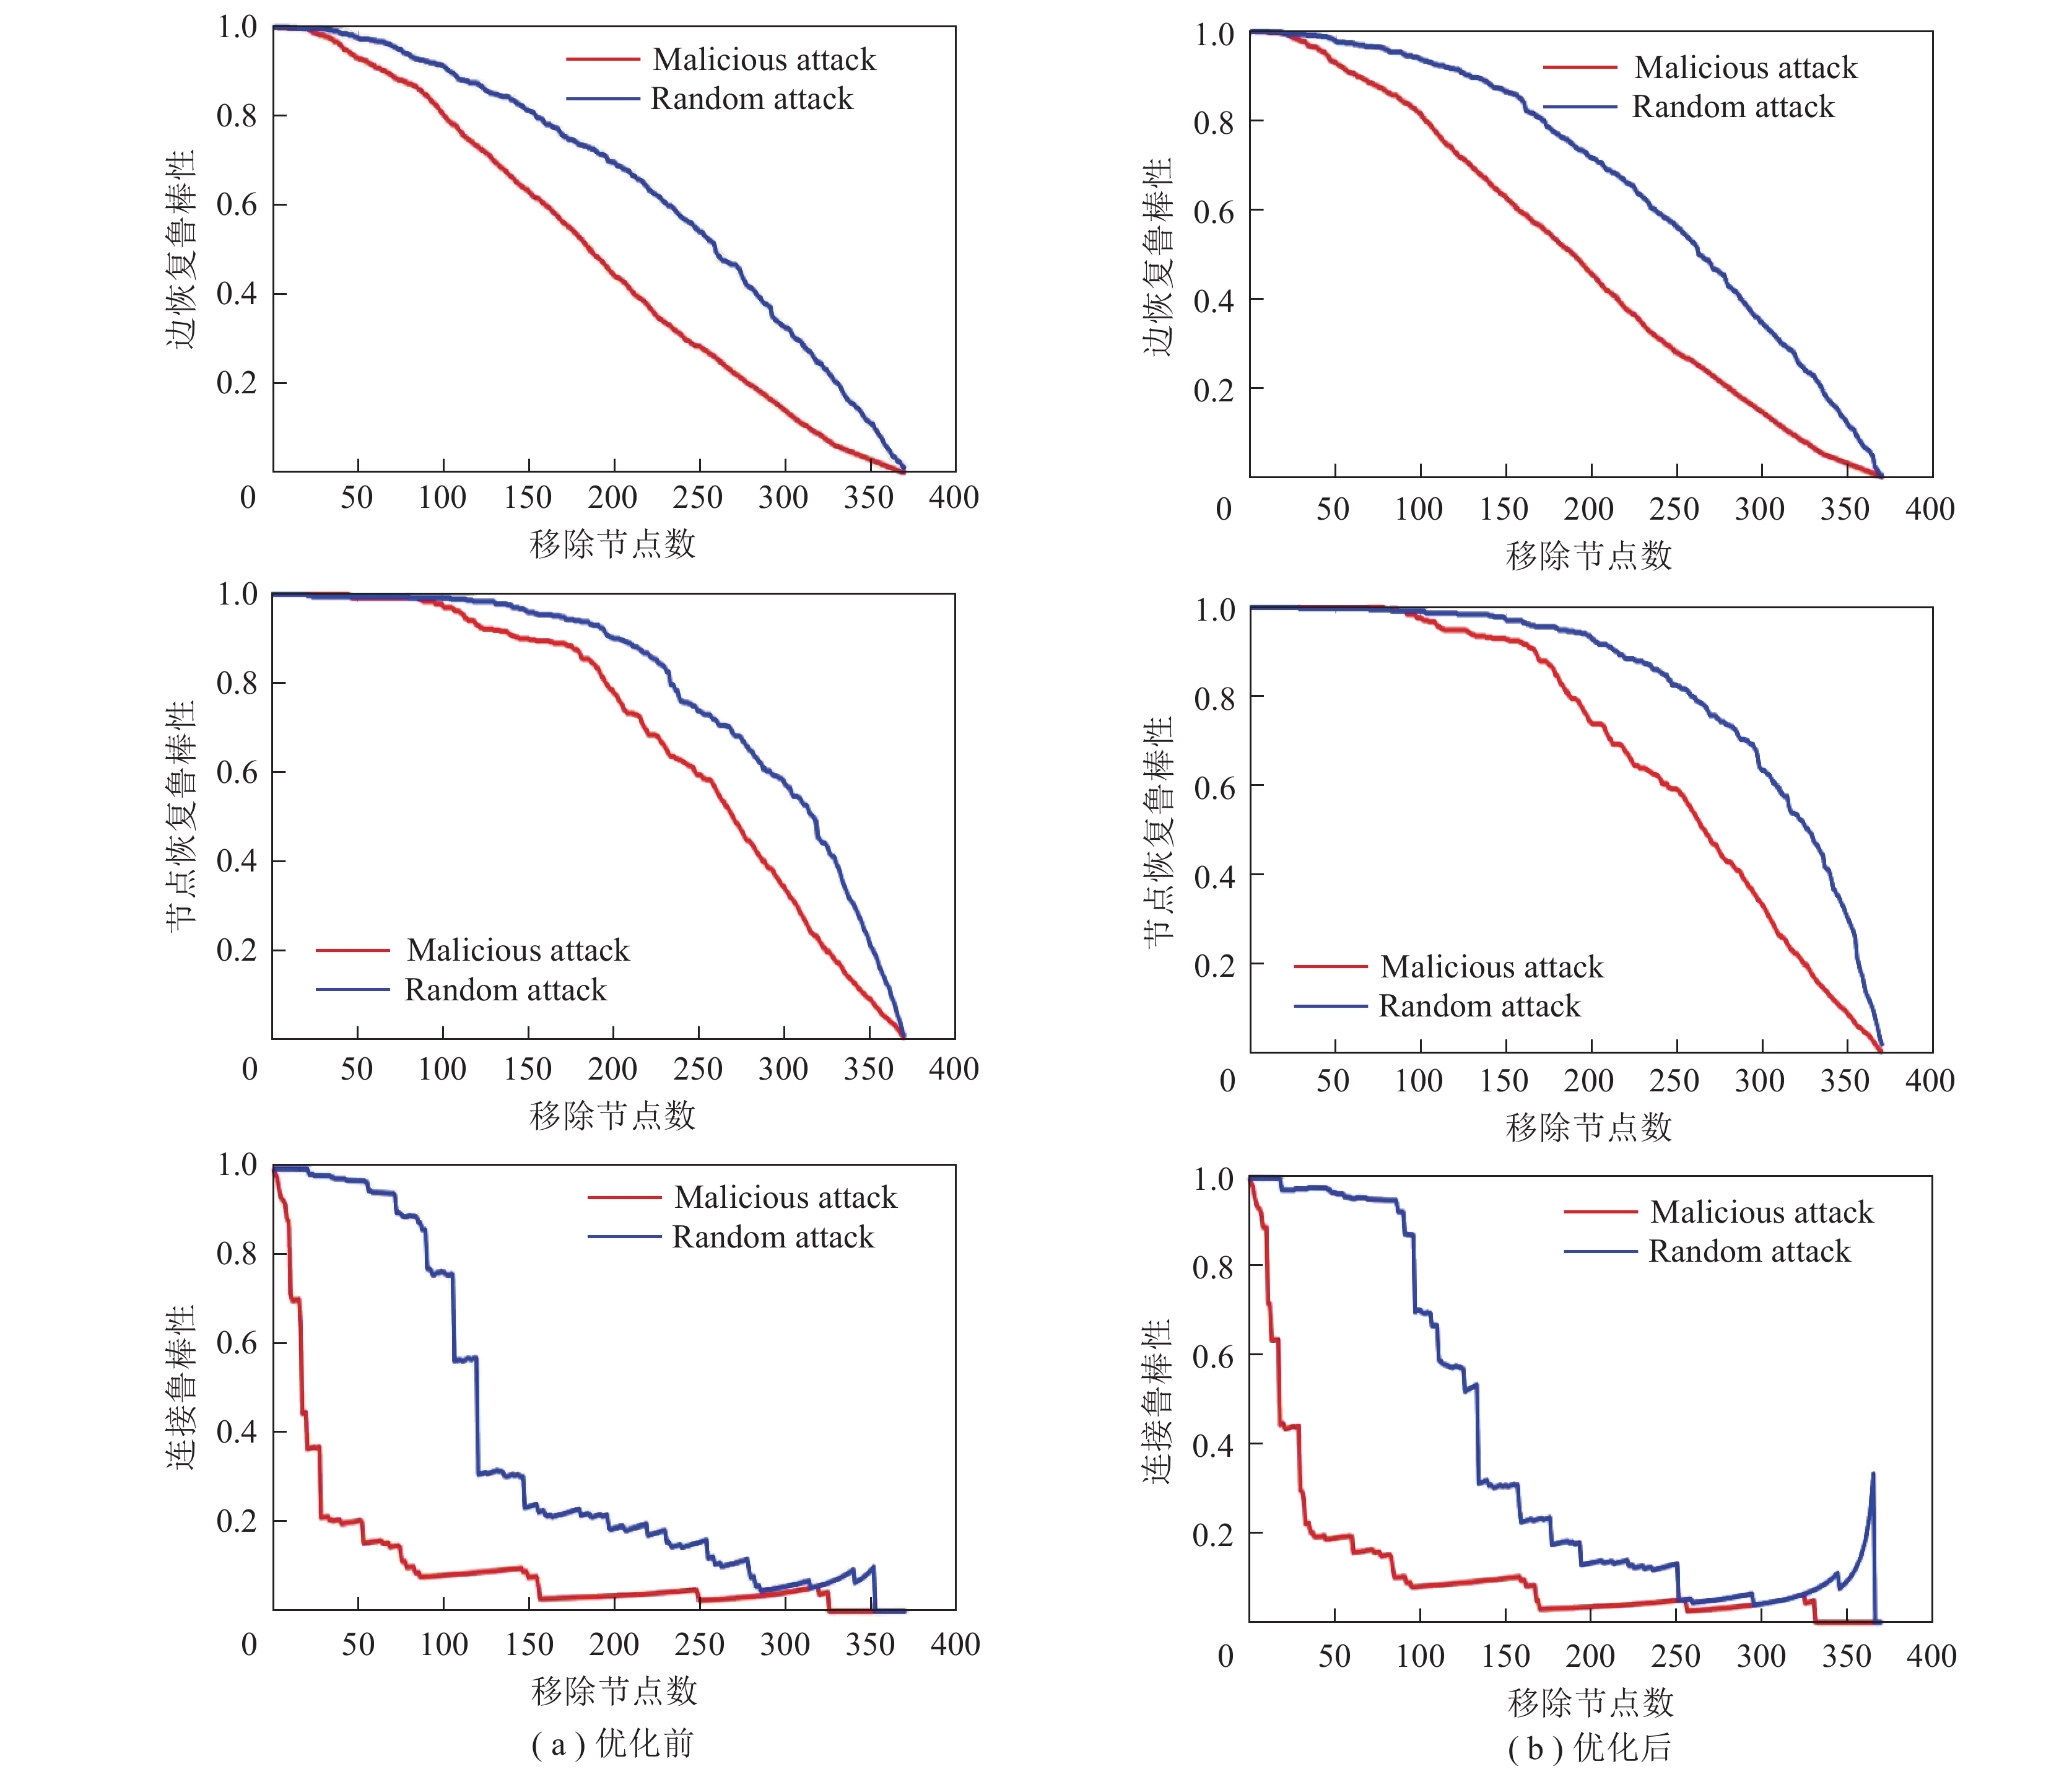
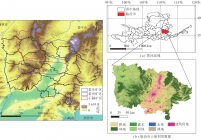
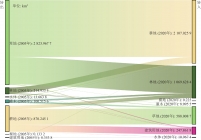
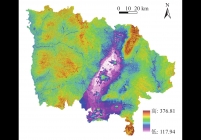
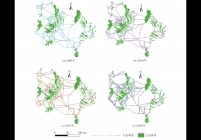
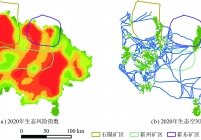
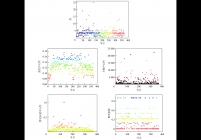
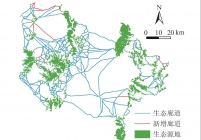
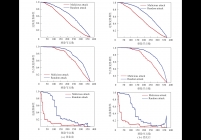
资源型城市景观结构的变化受到多种因素的综合影响,这导致了其景观生态质量的降低的可能性以及生态环境的脆弱性增加,景观生态质量对生态功能的流动与传递具有直接影响,因此在构建景观生态网络时应予以关注。基于2005—2020年中国山西省临汾市的土地利用数据进行分析,建立了一种景观生态风险评估模型,并分析了2005—2020年景观生态风险的时空特征。在充分考虑了生态系统抵抗力受到景观生态质量影响的前提下,以2020年景观生态风险评估为基础,通过MSPA法提取生态源地,运用最小累积抵抗力模型(MCR)构建廊道,并搭建了景观生态网络,并通过复杂网络方法探讨了景观生态网络的拓扑性质。研究区域内高风险地区和极高风险地区的面积呈现先上升后下降的趋势,整体风险水平有所下降。城市建设用地与采矿用地周边地区的风险相对较高,而森林和草地地区的风险则相对较低。研究区风险变化主要受采矿、城市扩张、政府政策、土地利用类型改变以及村落迁移等因素的影响。通过增边策略对景观生态网络进行优化,对比优化前后生态网络鲁棒性,发现增边策略增强了能量传输的畅通性和节点间的互联性,该生态风险评估模型结合潜在生态网络的构建有助于为资源型城市景观结构优化和生态安全体系建设提供理论支持。
The changes in the landscape structure within resource-dependent urban areas is influenced by a confluence of factors, potentially resulting in a decreased landscape ecological quality and a heightened ecological vulnerability. Landscape ecological quality directly influences the flow and transmission of ecological functions, rendering it a pivotal consideration in the development of landscape ecological networks. In this study, an investigation was conducted utilizing land-use data spanning from 2005 to 2020, encompassing the city of Linfen in Shanxi Province, China. A landscape ecological risk assessment model was formulated to analyze the spatiotemporal attributes of landscape ecological risk during this timeframe. Acknowledging the underlying connection between ecosystem resilience and landscape ecological quality, the 2020 landscape ecological risk assessment served as the basis for the extraction of ecological source areas using the Minimum Spanning Tree with Path Algorithm (MSPA), and the corridors were established using the Minimum Cumulative Resistance (MCR) model. This framework facilitated the construction of a landscape ecological network, and the complex network analysis was employed to scrutinize the network’s topological properties. The regions within the study area exhibiting high and extremely high ecological risk displayed an initial increase followed by a subsequent decrease, culminating in an overall reduction in risk levels. The areas surrounding urban development and mining activities displayed relatively heightened risk levels, while the regions characterized by forests and grasslands experienced relatively lower risks. The shifts in risk within the study area were predominantly attributed to various factors, including mining activities, urban expansion, governmental policies, alterations in land-use types, and village migrations. Through the optimization of the landscape ecological network using edge addition strategies and a subsequent comparison of network robustness pre- and post-optimization, it was discerned that the edge addition strategy notably improved the efficiency of energy transfer and interconnectivity among network nodes. This ecological risk assessment model, in conjunction with the development of a prospective ecological network, lends a valuable theoretical support to the enhancement of landscape structure within resource-dependent urban areas and the establishment of comprehensive ecological security systems.
ecological restoration in mining areas;landscape ecological risk;spatial autocorrelation;ecological network;complex network optimization;robustness


主办单位:煤炭科学研究总院有限公司 中国煤炭学会学术期刊工作委员会
 煤炭学报
煤炭学报  2024年第06期