
主办单位:煤炭科学研究总院有限公司、中国煤炭学会学术期刊工作委员会
Optimization simulation and crushing experiment of anti-impact energy absorption component of hydraulic support column
TIAN Liyong;YU Xiaohan;ZHOU Yupeng;SUN Yexin;YU Ning
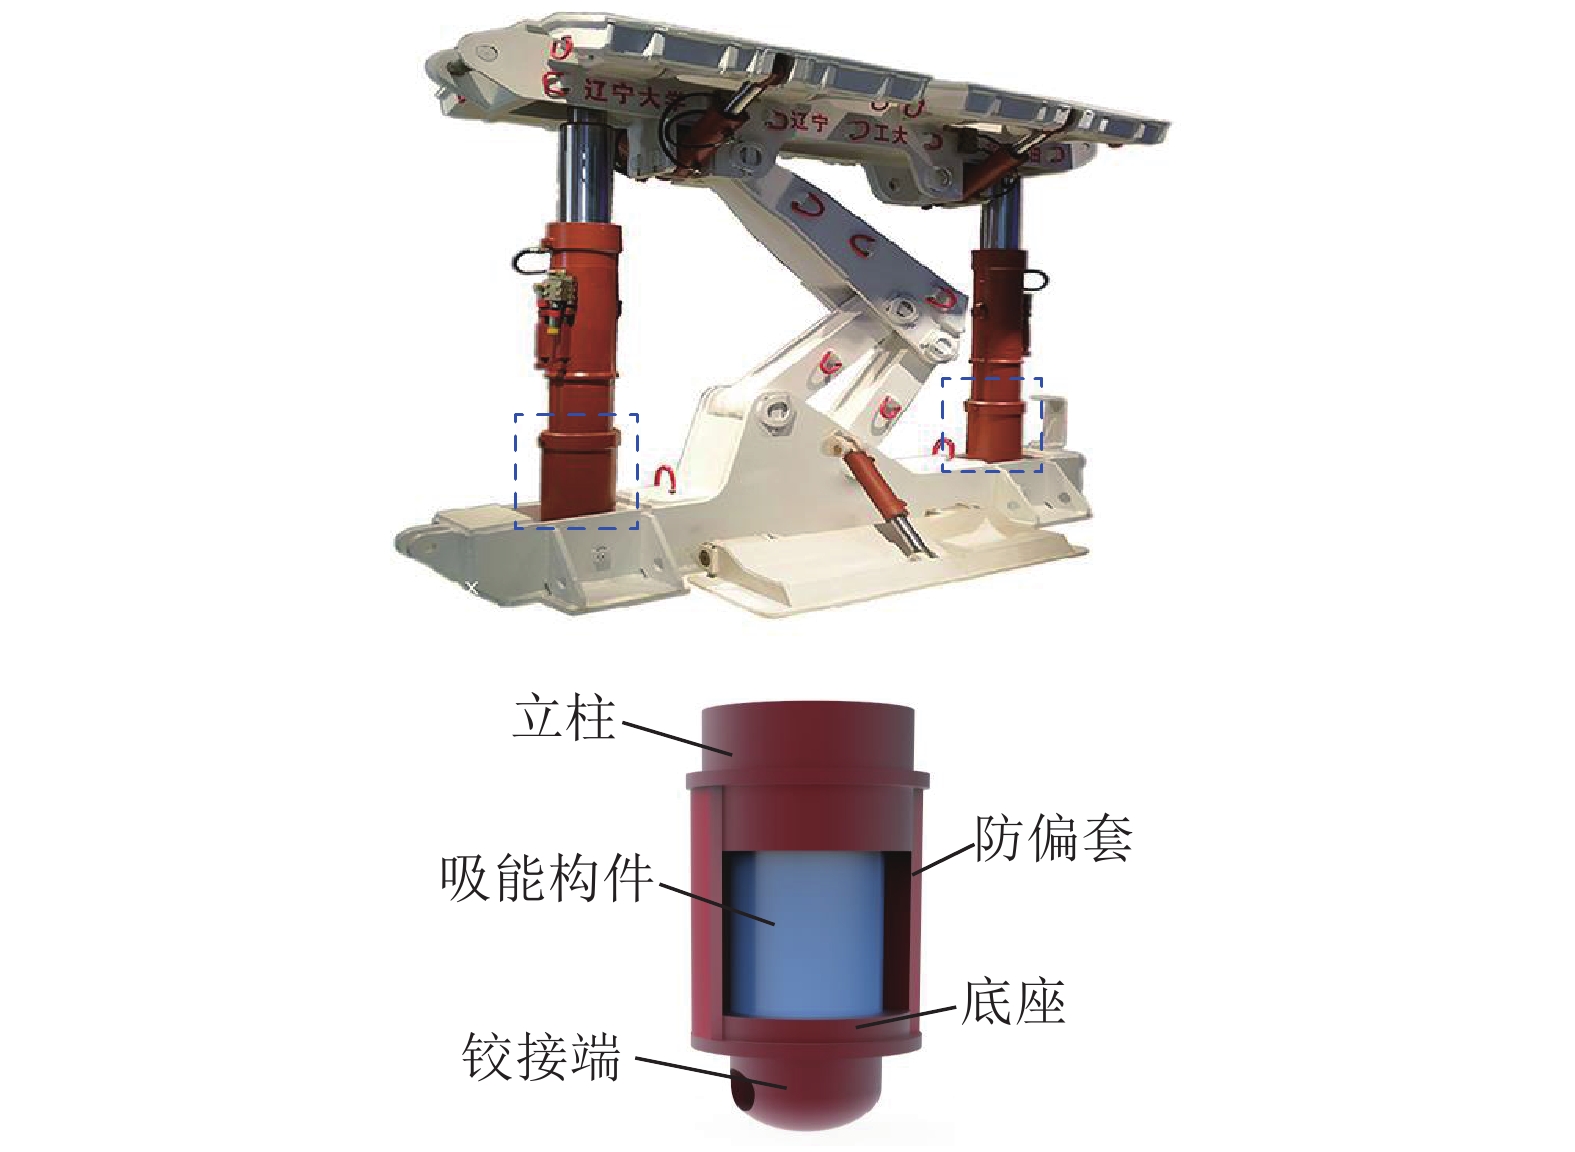
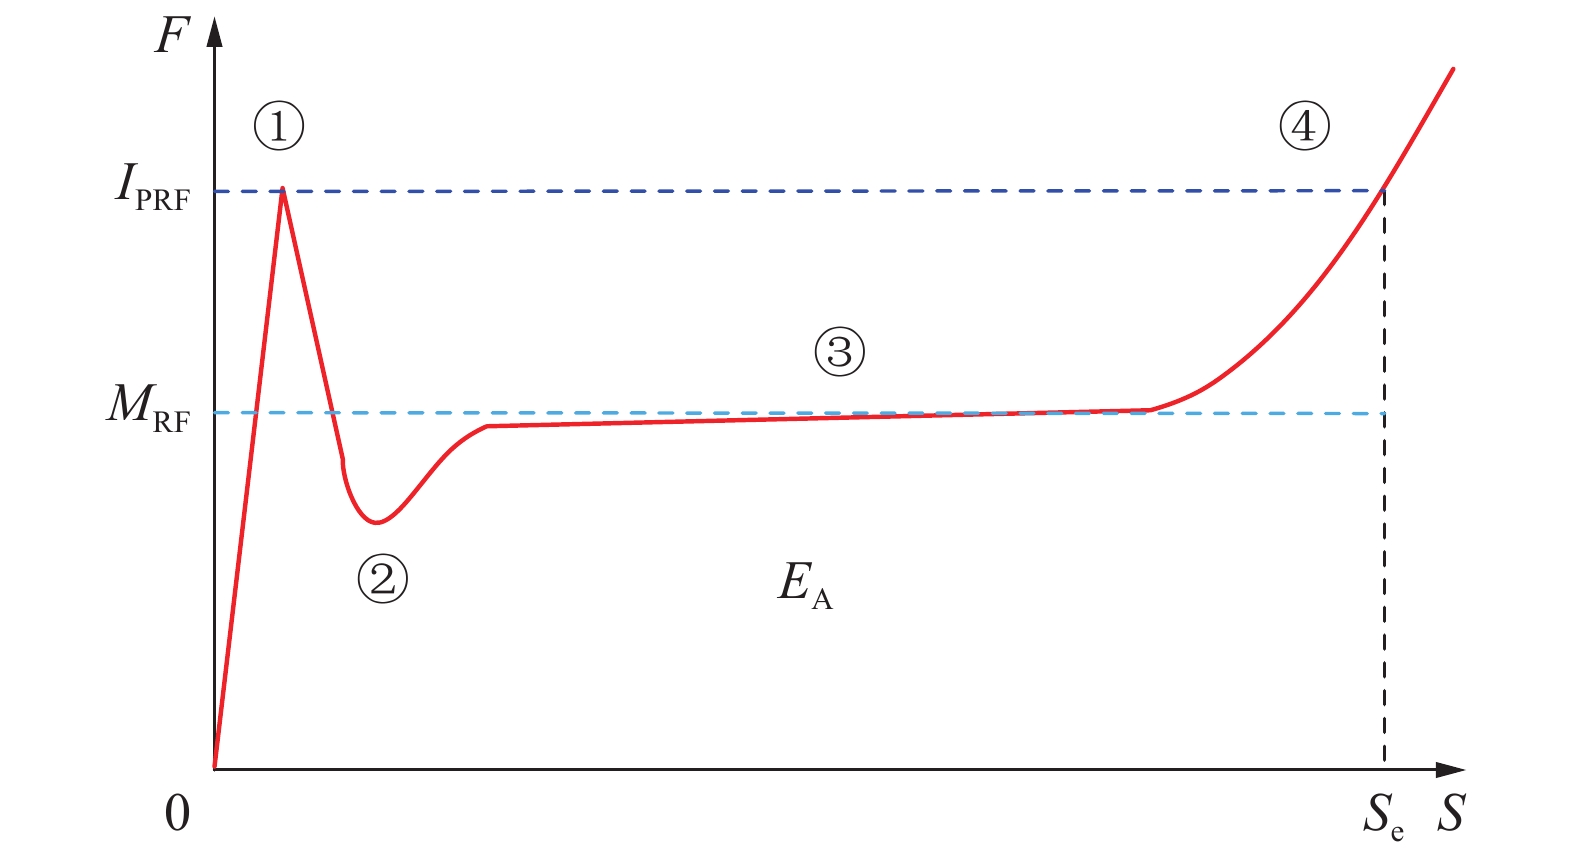
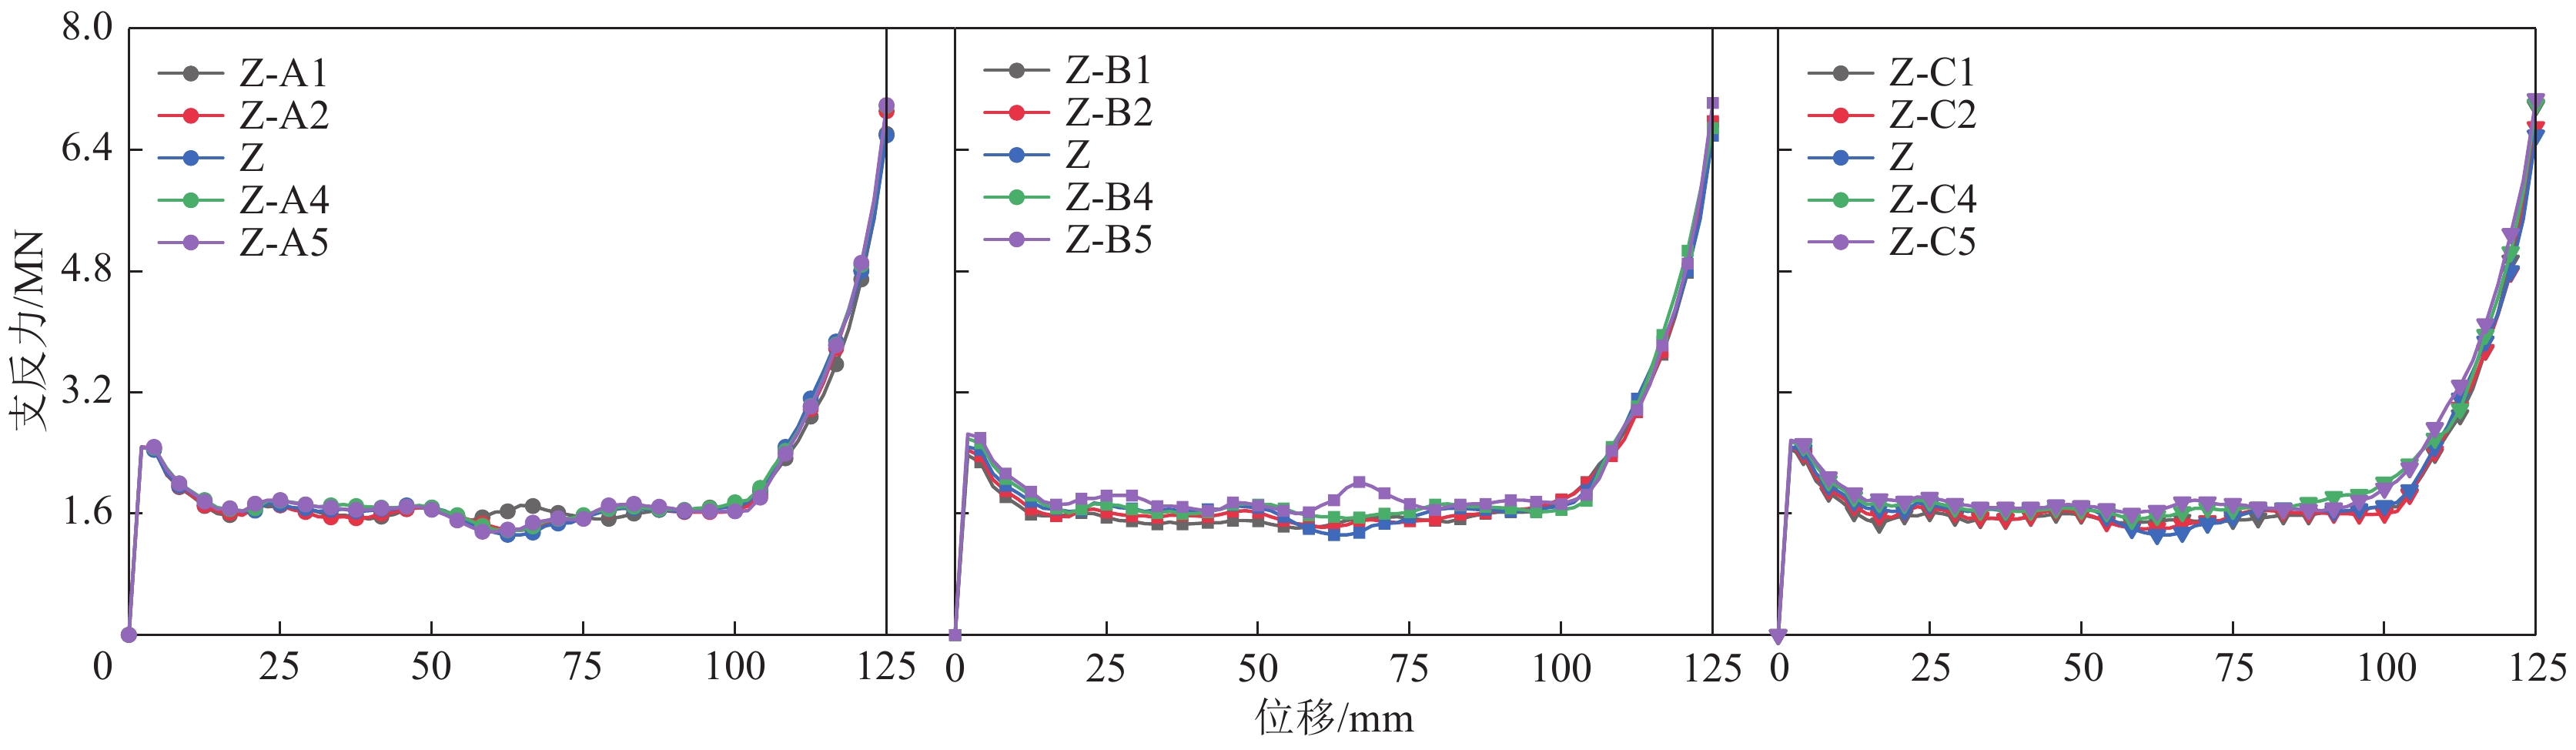
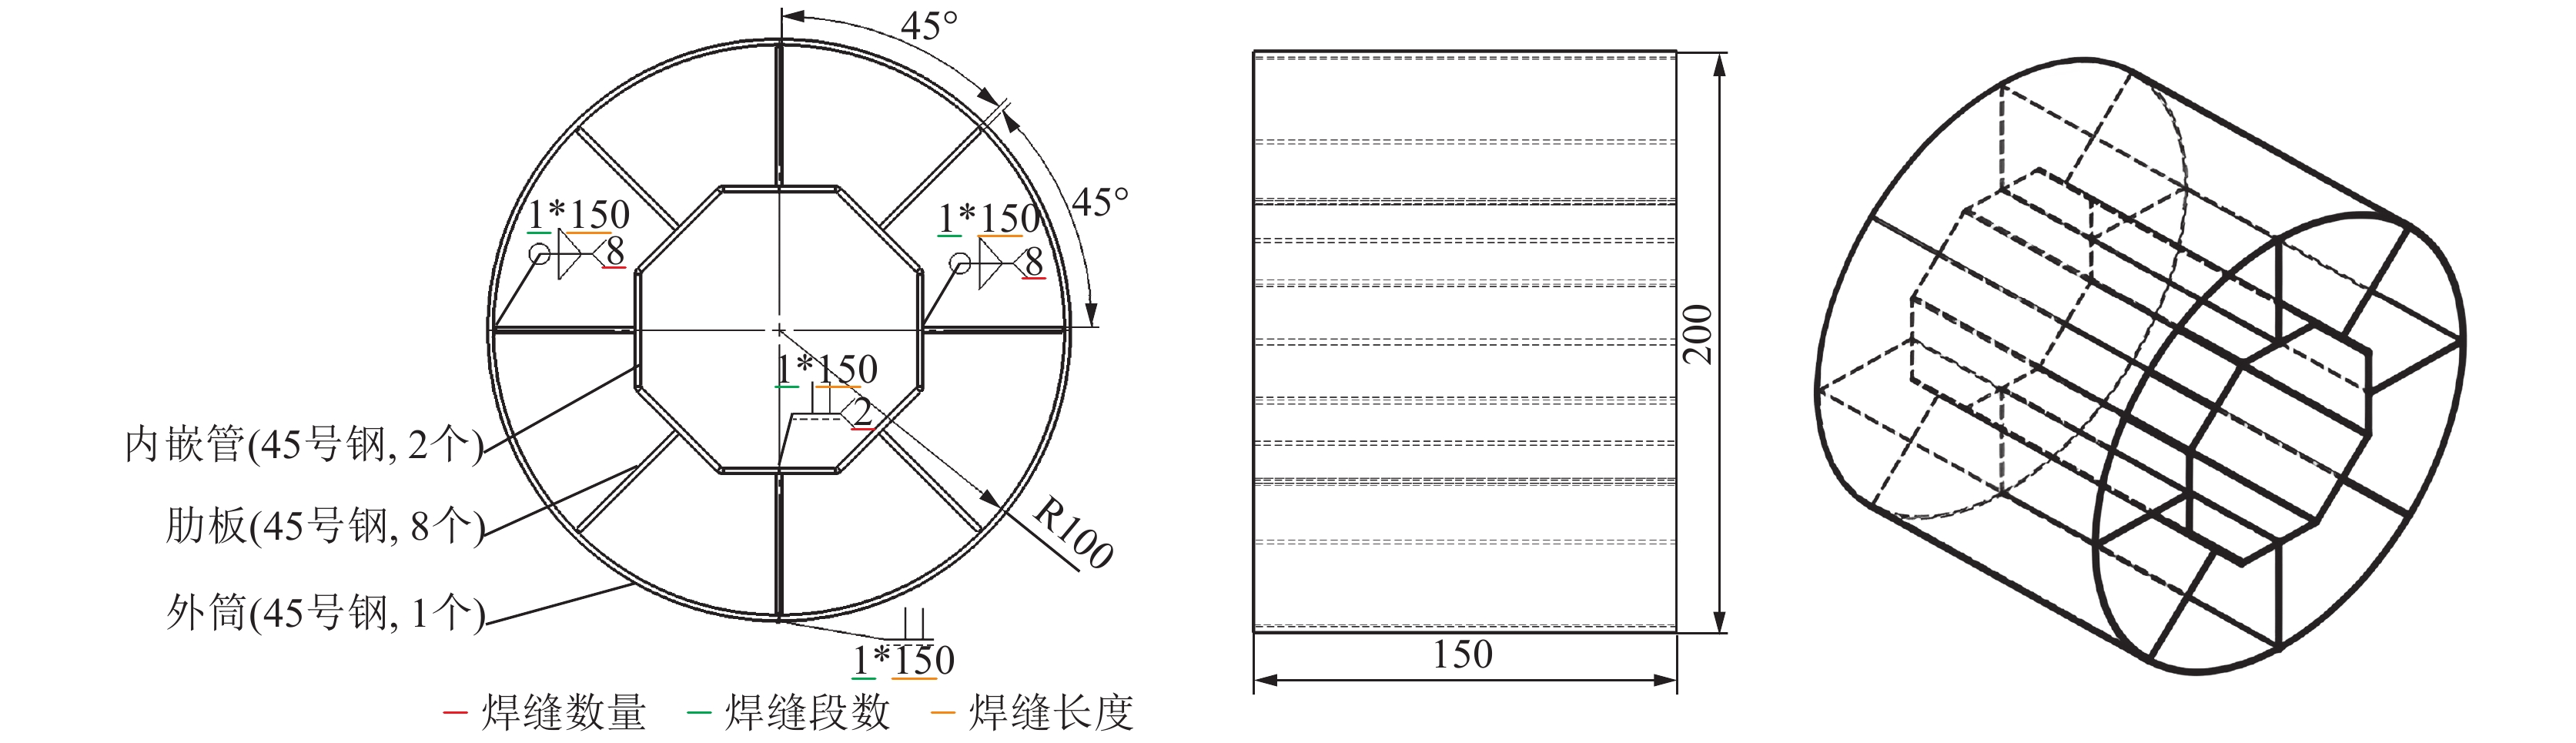
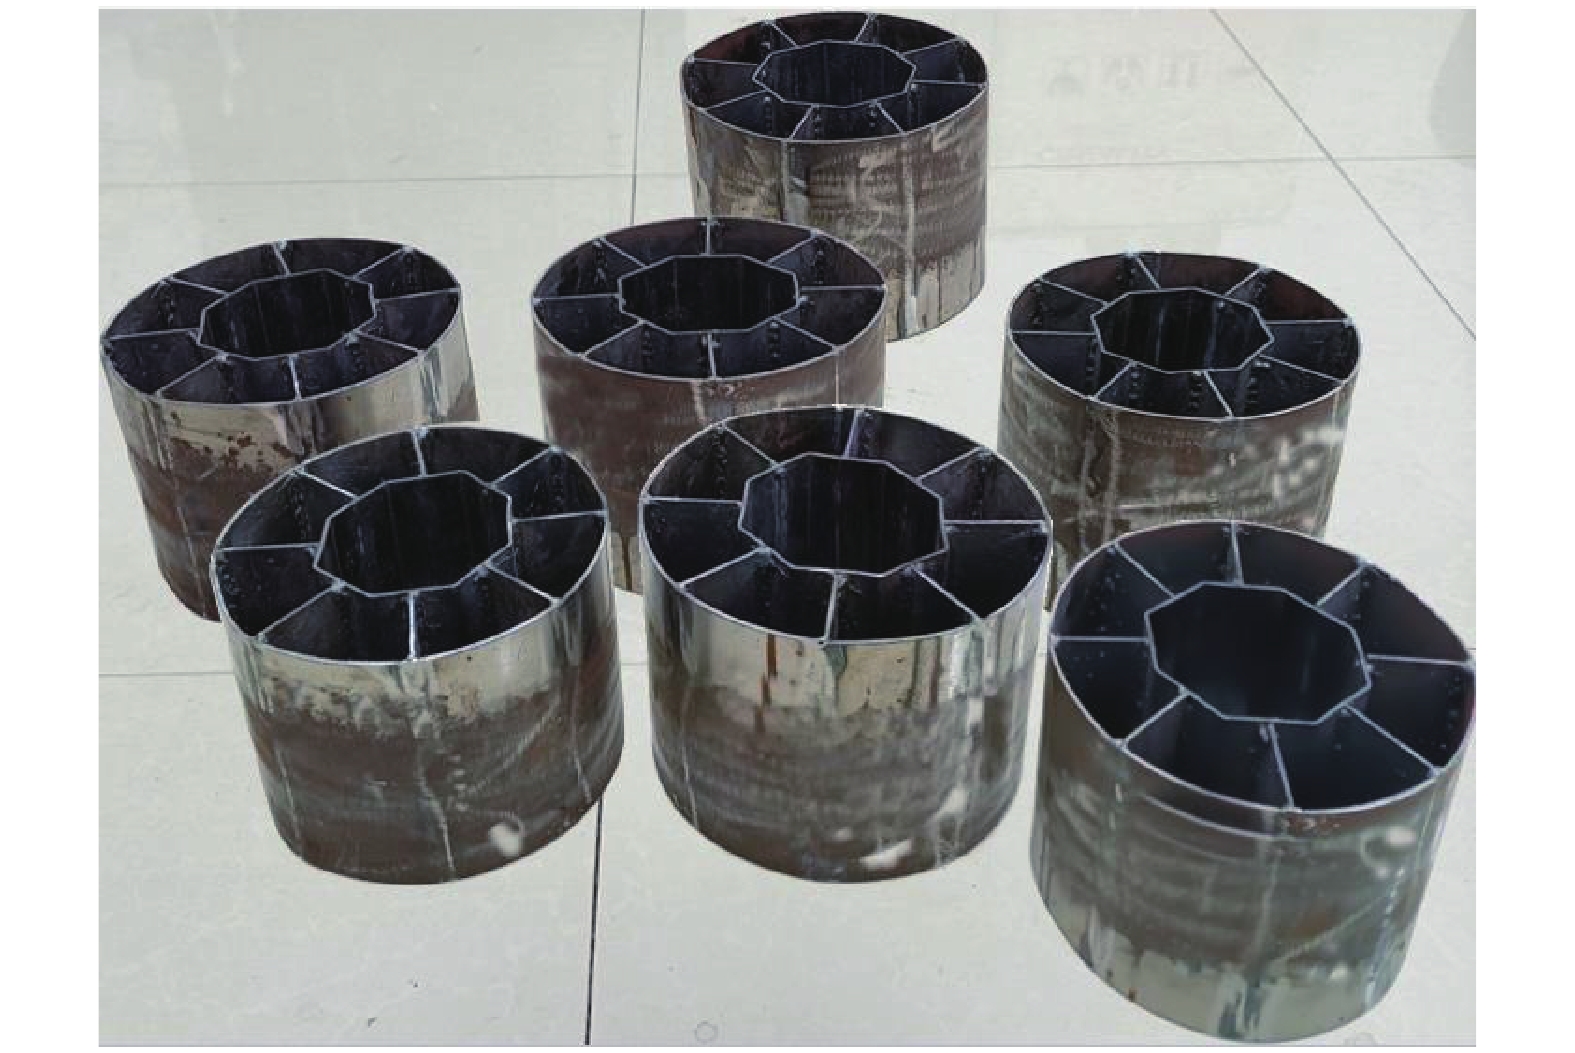
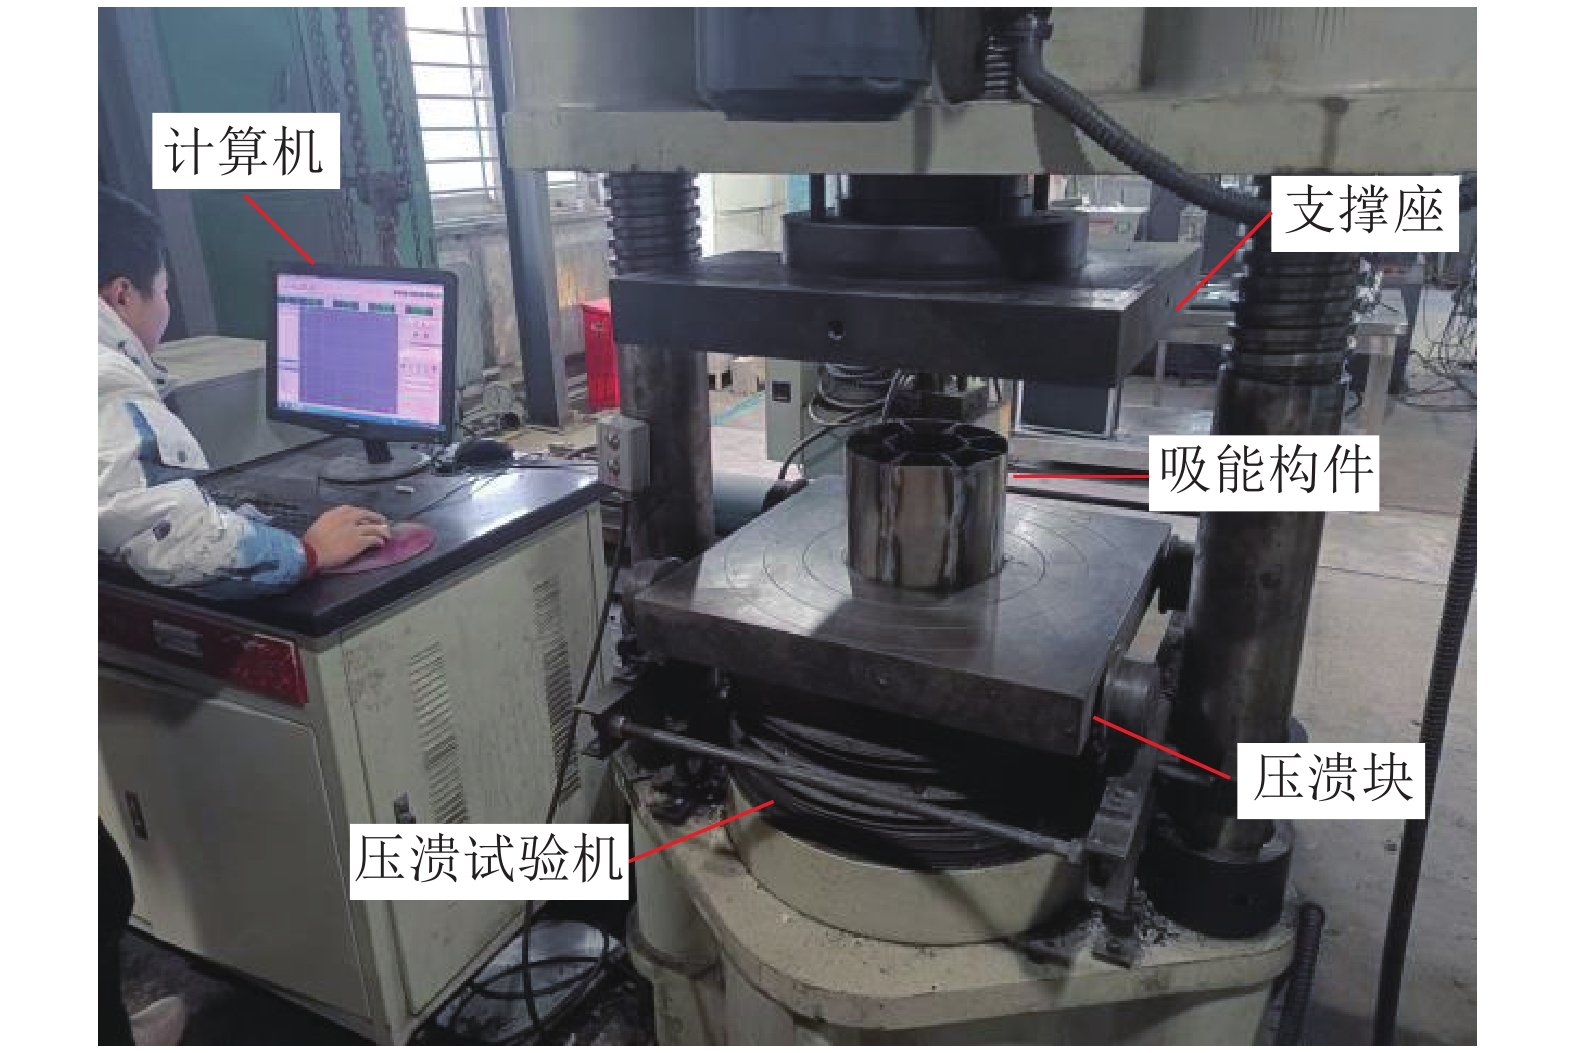
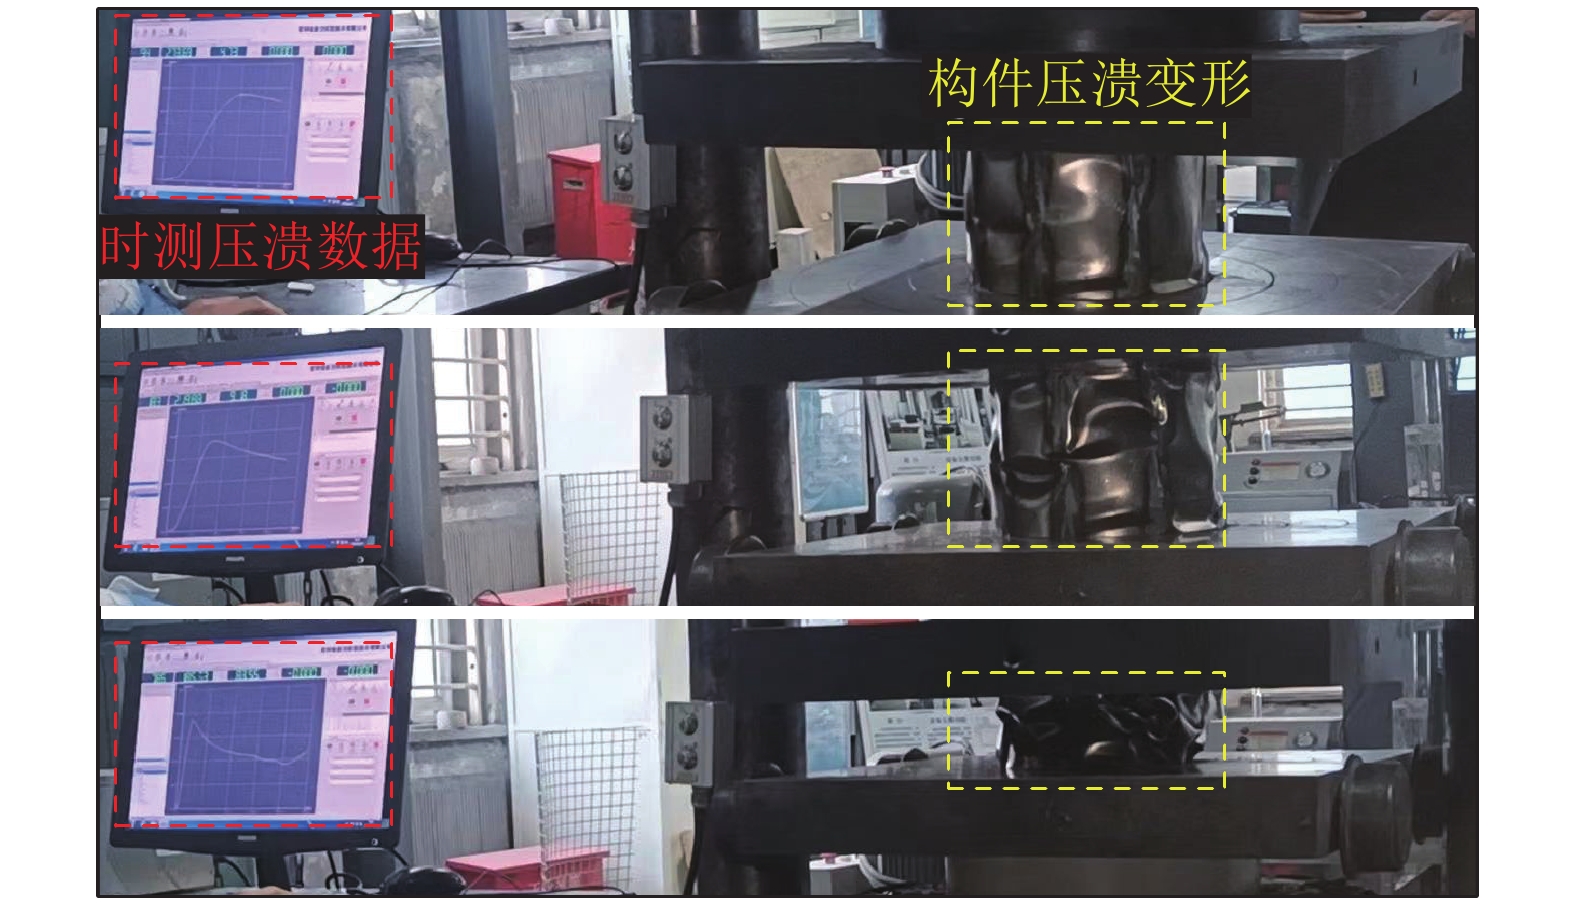
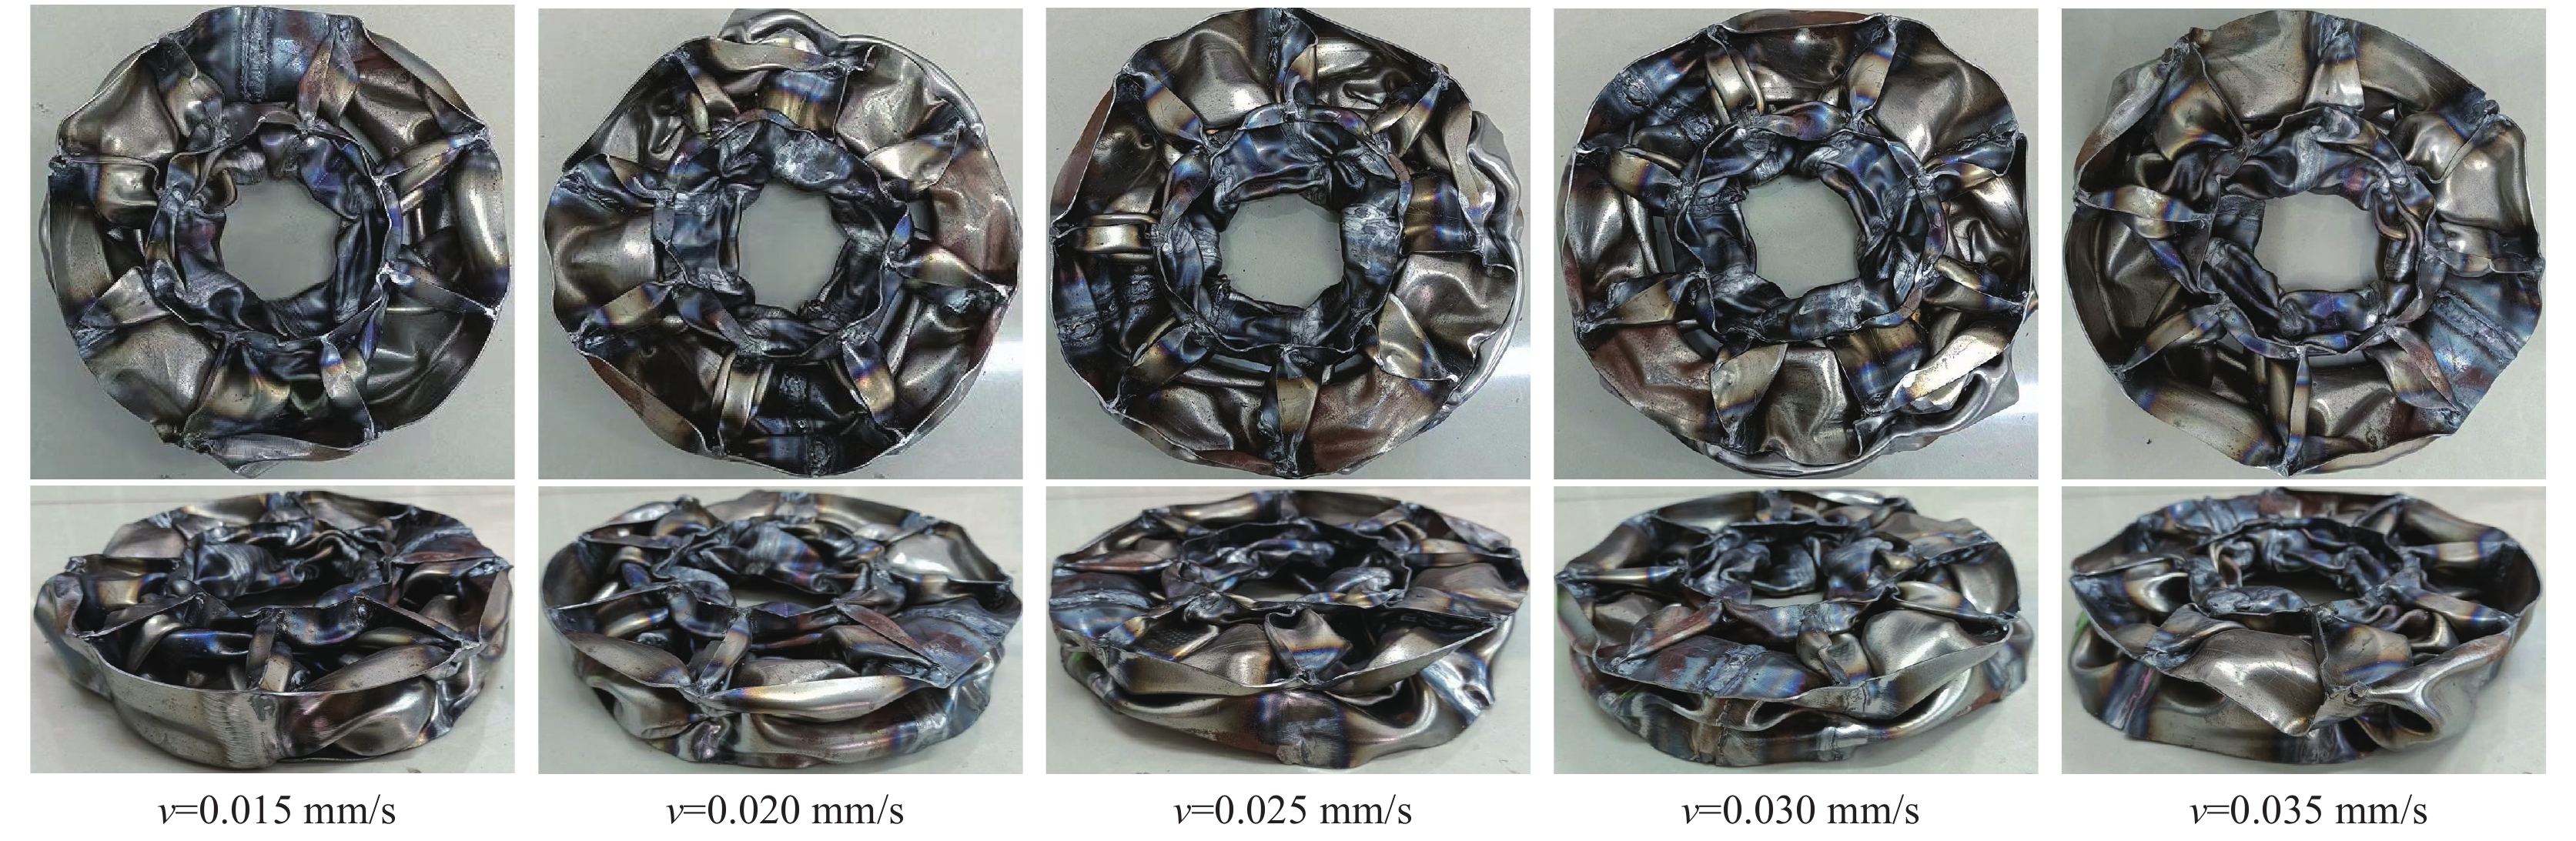
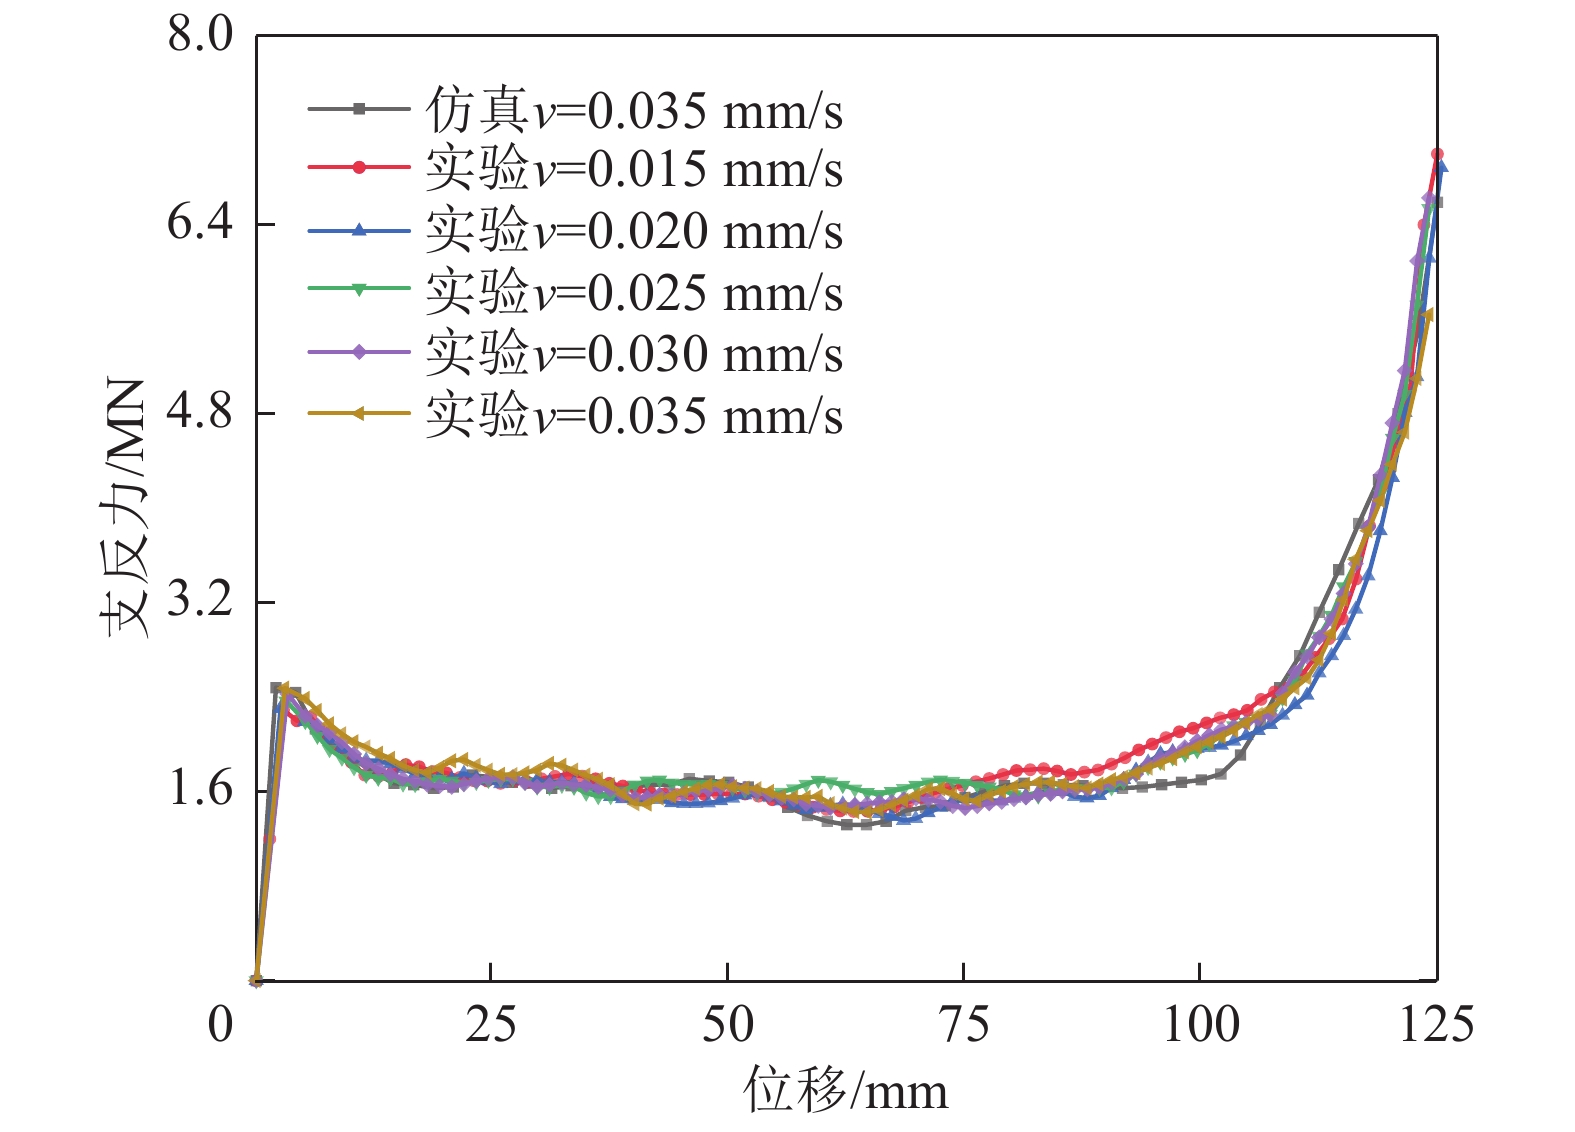
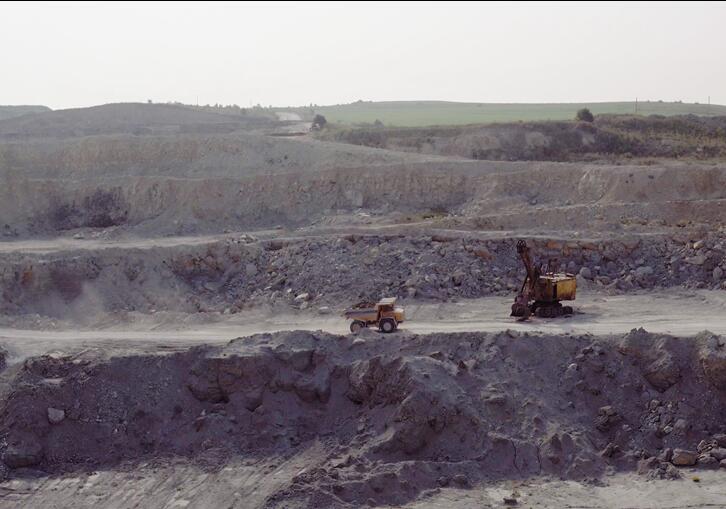
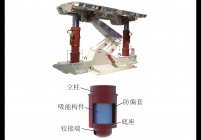
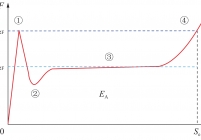
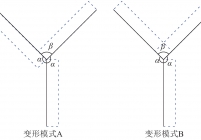
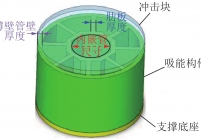
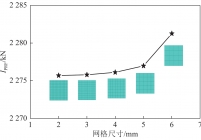
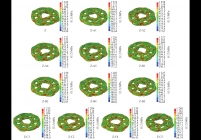
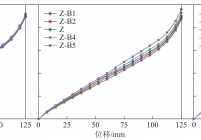
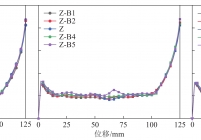
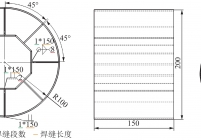
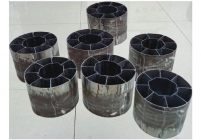
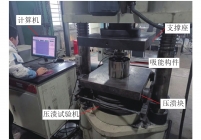
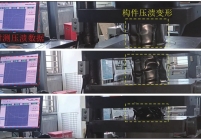
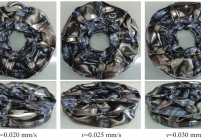
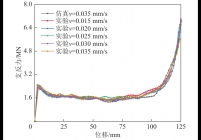
液压支架作为煤炭开采主要支护设备,经常受到冲击地压影响,防冲吸能构件起到保护液压支架作用,为获得更大的初始支反力峰值与吸能量、更小的支反力分散度,对吸能构件参数细化并通过ABAQUS有限元软件进行吸能构件的建模与压溃冲击仿真,获取吸能构件的吸能性能及屈曲变形形态,验证最优尺寸的吸能性能;对比吸能构件平均支反力的预测数据与有限元仿真数据,误差在15%以内,最优尺寸构件的平均支反力模型预测误差为−3.40%,验证吸能构件预测模型所预测数据较为准确;搭建吸能构件压溃实验台,选择5种加载速度,以准静态压溃方式对定制加工的吸能构件进行轴向加载压溃实验,实验结果表明:不同加载速度轴向压溃实验,支反力波动基本一致,最大初始支反力峰值为2 253.52 kN,最大支反力标准差为206.23 kN,最小初始支反力峰值为2 096.26 kN,最小支反力标准差为189.83 kN,初始支反力峰值的平均值为2 149.32 kN,支反力标准差平均值为196.77 kN;不同压溃速度下的轴向压溃实验数据与吸能构件有限元仿真数据对比,初始支反力峰值、支反力标准差的相对误差分别为5.6%、11.07%;对最优尺寸吸能构件通过预测模型法、有限元仿真法、压溃实验法三种方法进行吸能性能分析,预测模型法的平均支反力为1 879.7 kN,有限元仿真法的平均支反力为1 945.9 kN,压溃实验法平均支反力为1 919.8 kN,预测模型误差3.41%,压溃实验误差−1.3%,通过3种方法的数据验证结果,证明了吸能构件分析方法的可靠性和可行性。
Hydraulic support, being the primary supporting equipment in coal mining operations, is frequently subjected to rock burst pressure. Hence, the anti-impact energy absorption components play a pivotal role in safeguarding the hydraulic support system. Based on the research foundation established by our anti-impact components research group, a detailed investigation on the parameters of energy-absorbing components was conducted for achieving an enhanced initial peak force and absorption energy, as well as reducing the dispersion of reaction forces. Subsequently, the ABAQUS finite element software was employed for modeling and simulating the crushing impact behavior of these energy-absorbing components. The energy absorption performance and buckling deformation characteristics of the energy absorption component were determined, and the optimal size was experimentally validated for its energy absorption performance. By comparing the predicted average support force data of the energy-absorbing member with the finite element simulation results, it was observed that the error is below 15%. Furthermore, for the optimal size member, the prediction error of the average support force model is −3.40%, thus confirming a higher level of accuracy in predicting data for the energy-absorbing members. A test platform was constructed to evaluate the crushing behavior of energy-absorbing components. The experiment involved conducting axial loading crushing tests on the custom-designed components under quasi-static conditions, with five different loading speeds selected. The experimental results demonstrate that the fluctuation of support reaction remains consistent across axial crushing experiments conducted at different loading speeds. The maximum peak value of initial support reaction is 2 253.52 kN, with a standard deviation of 206.23 kN. The minimum peak value of the initial support reaction is recorded as 2 096.26 kN, with a standard deviation of 189.83 kN. The average value for the initial support reaction peak is determined to be 2 149.32 kN, accompanied by an average standard deviation of 196.77 kN. The relative errors of the initial support reaction peak and standard deviation, compared to the finite element simulation data, are 5.6% and 11.07%, respectively. The energy absorption performance of the optimally sized energy-absorbing component was analyzed using three methods: a prediction model, finite element simulation, and crushing experiments. The average support reaction force obtained from the prediction model method is 1 879.7 kN, while that from the finite element simulation method is 1 945.9 kN, and that from the crushing experiment method is 1 919.8 kN. The prediction model exhibits an error rate of 3.41%, while the crushing experiment demonstrates a deviation of −1.3%. The reliability and feasibility of the analysis method for the energy-absorbing components are substantiated through the data verification results from these three approaches.
hydraulic pressure support;energy absorbing member;component processing;optimal size;crushing test


主办单位:煤炭科学研究总院有限公司 中国煤炭学会学术期刊工作委员会
 煤炭学报
煤炭学报  2024年第06期