• 论文
主办单位:煤炭科学研究总院有限公司、中国煤炭学会学术期刊工作委员会
冲击危险区域多元地球物理指标动态辨识方法及其应用
  • Title

    Dynamic identification method for rockburst hazard areas based on multivariate geophysical indicators and its application

  • 作者

    王爱文李超潘一山宋义敏范德威魏传奇于新河卢闯

  • Author

    WANG Aiwen;LI Chao;PAN Yishan;SONG Yimin;FAN Dewei;WEI Chuanqi;YU Xinhe;LU Chuang

  • 单位

    辽宁工程技术大学 矿业学院辽宁大学 灾害岩体力学研究所北方工业大学 土木工程学院吉林省龙家堡矿业有限责任公司辽宁大学 环境学院

  • Organization
    College of Mining Engineering, Liaoning Technical University
    Institute of Disaster Rock Mechanics, Liaoning University
    School of Civil Engineering, North China University of Technology
    Jilin Longjiapu Mining Co., Ltd.
    Environmental Engineering College, Liaoning University
  • 摘要

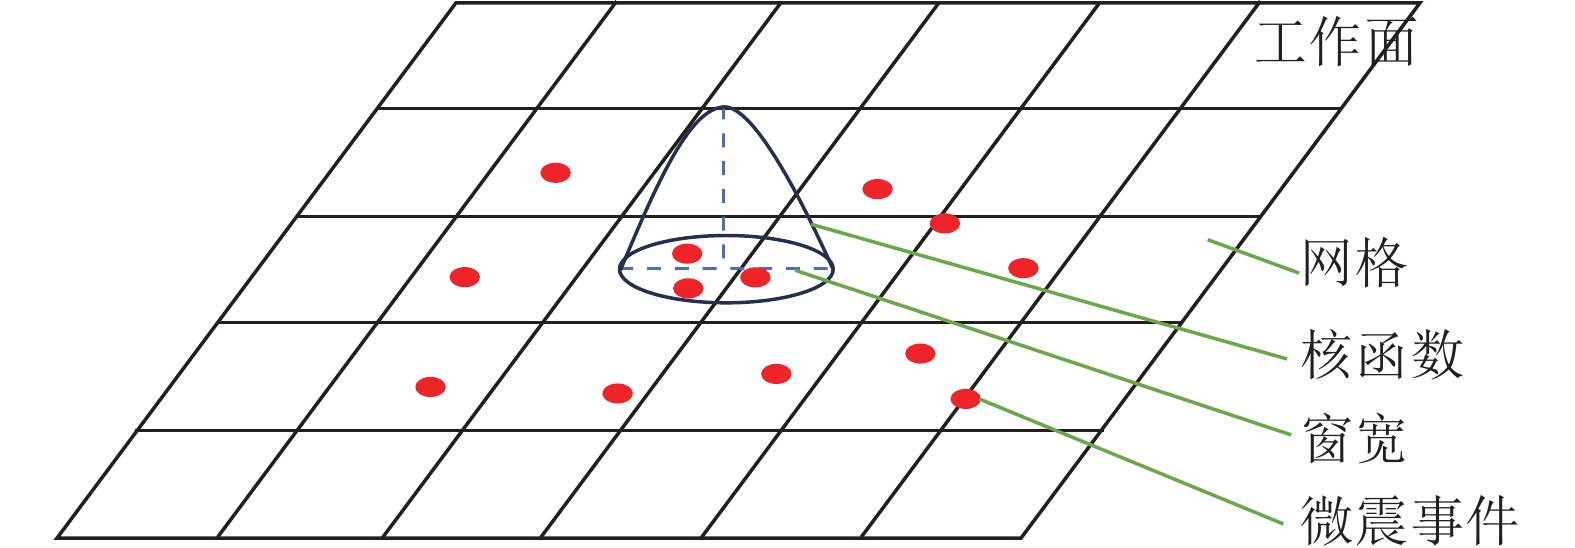
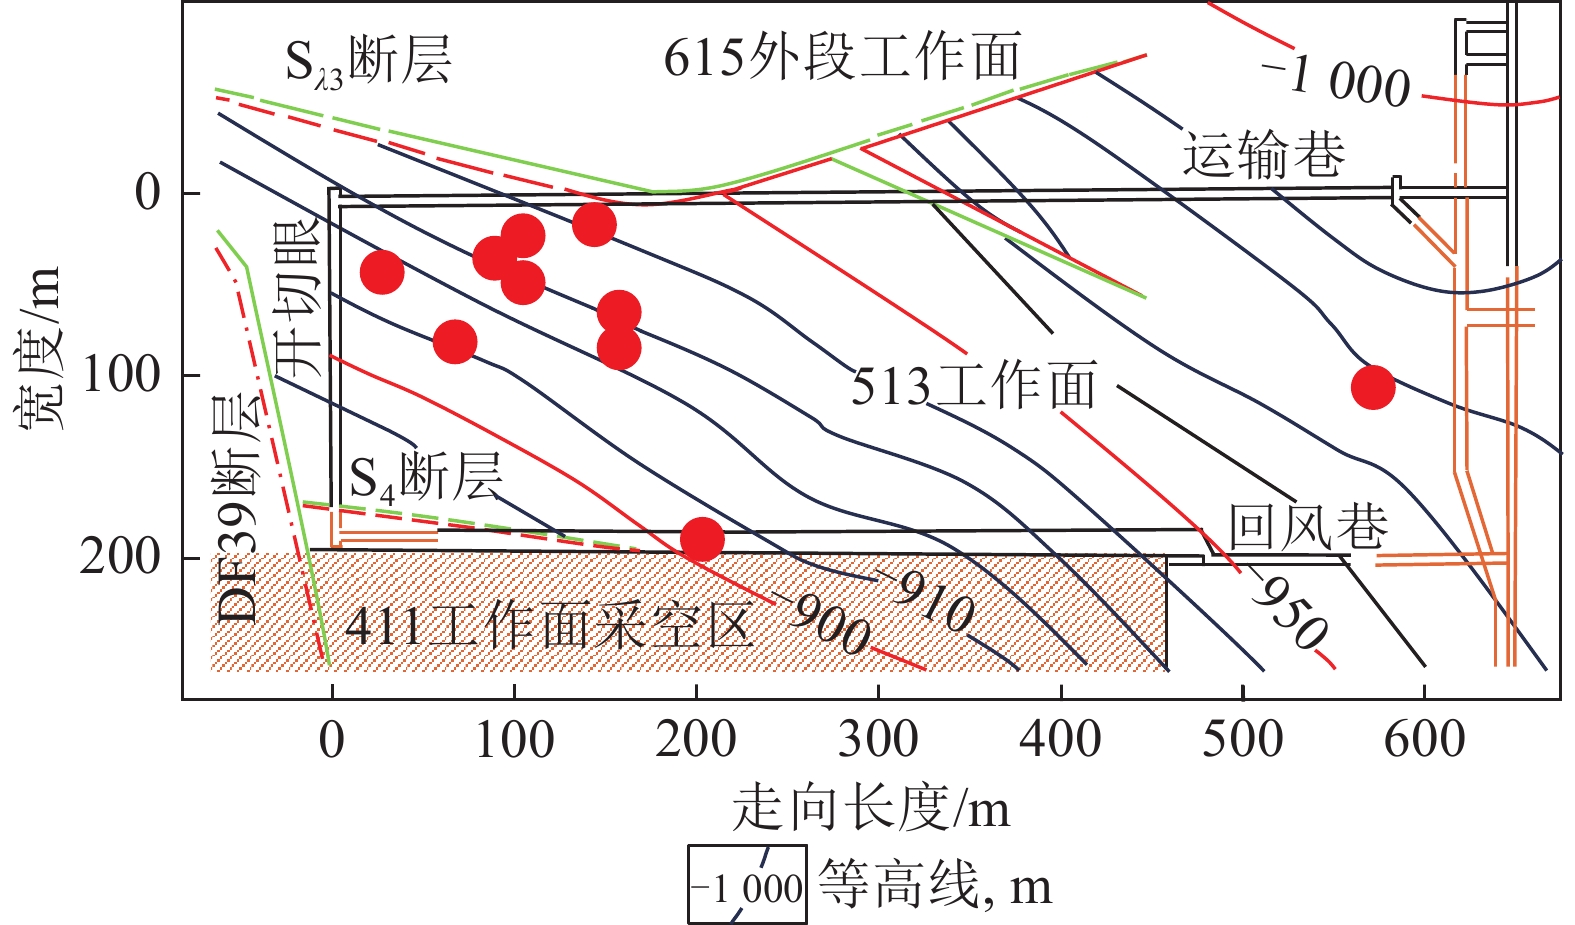
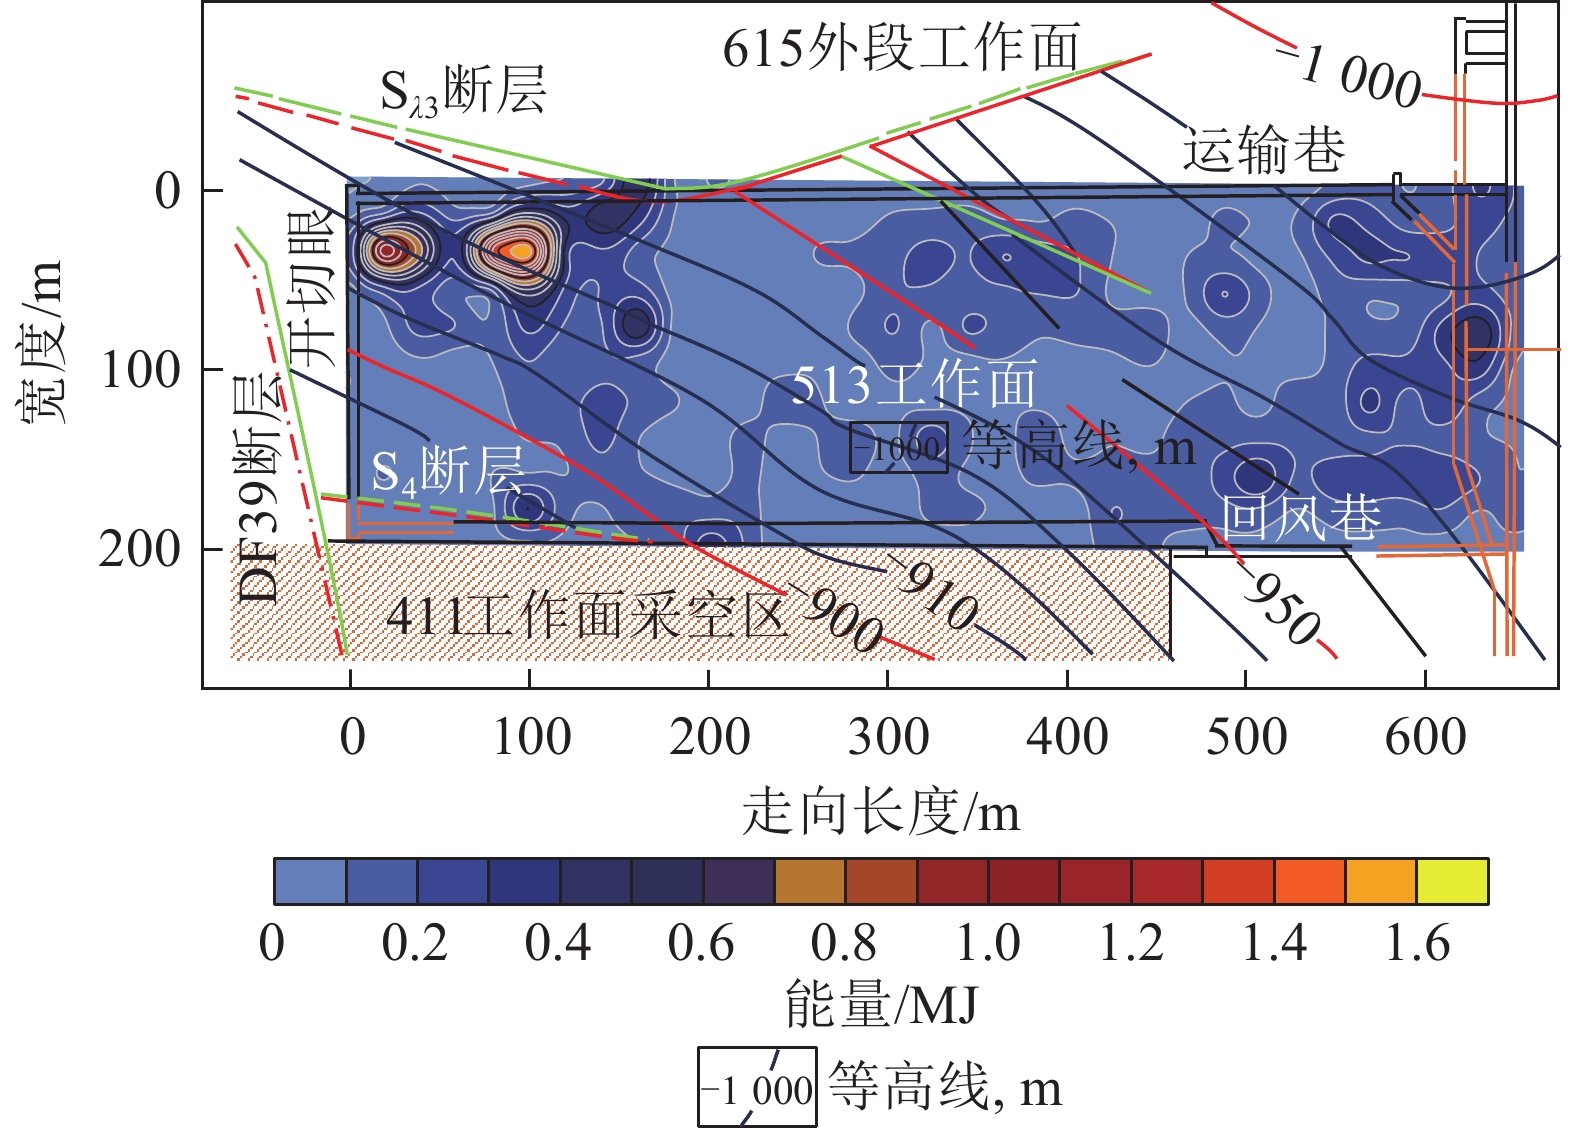
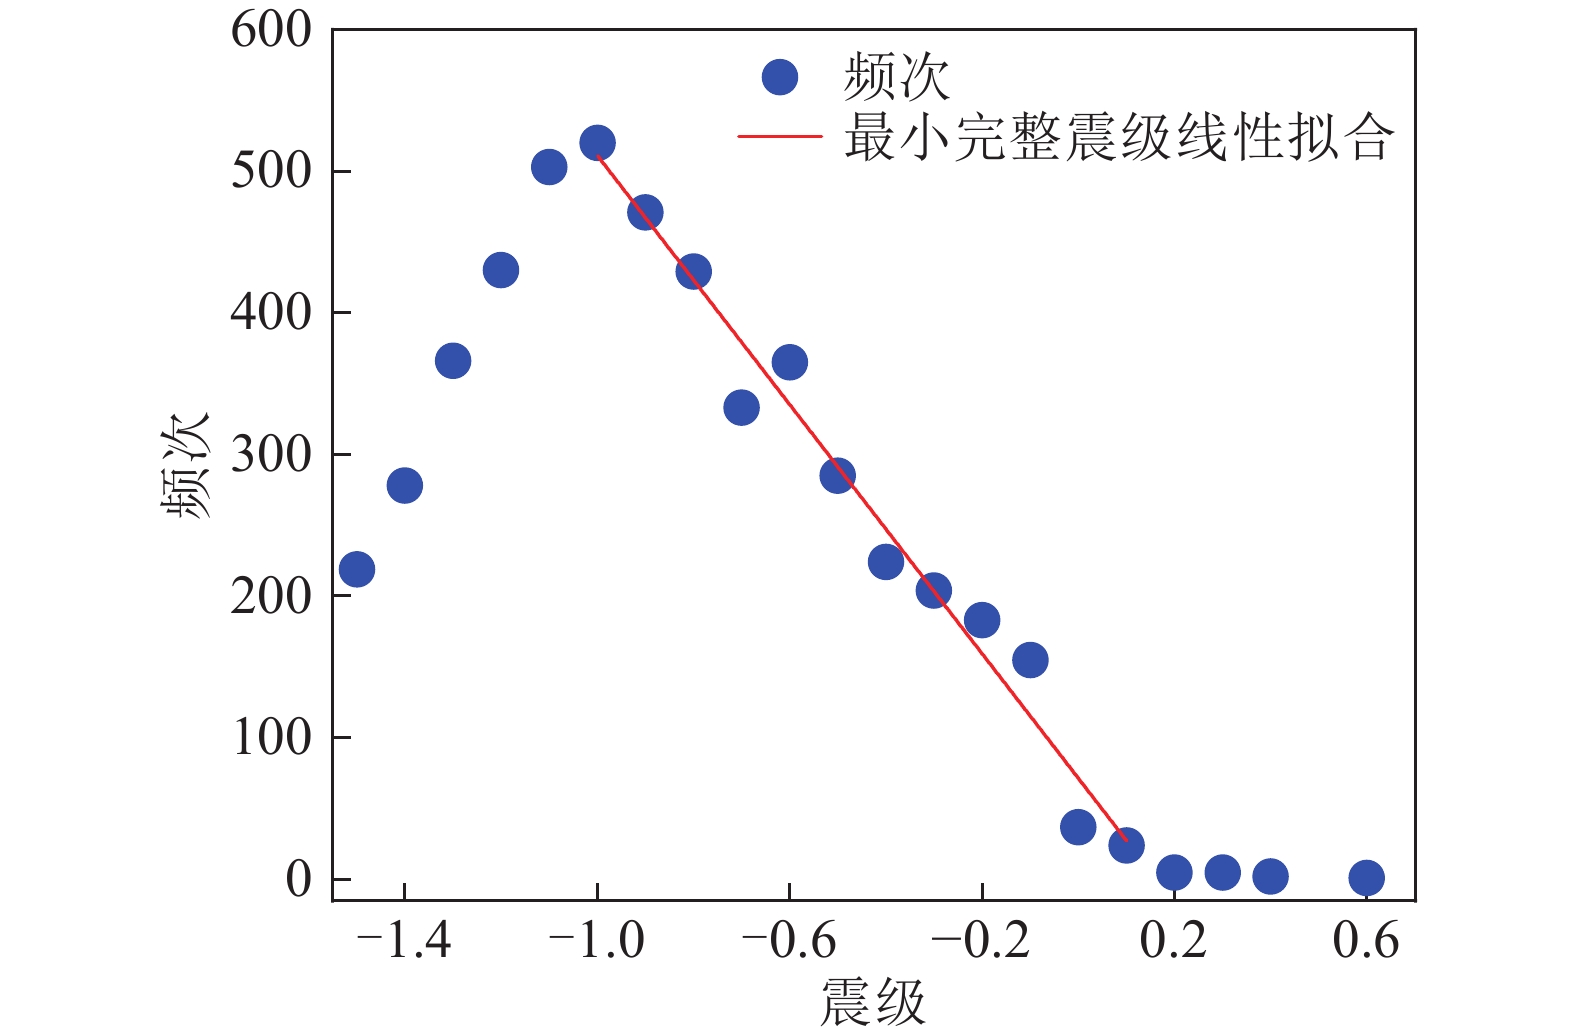
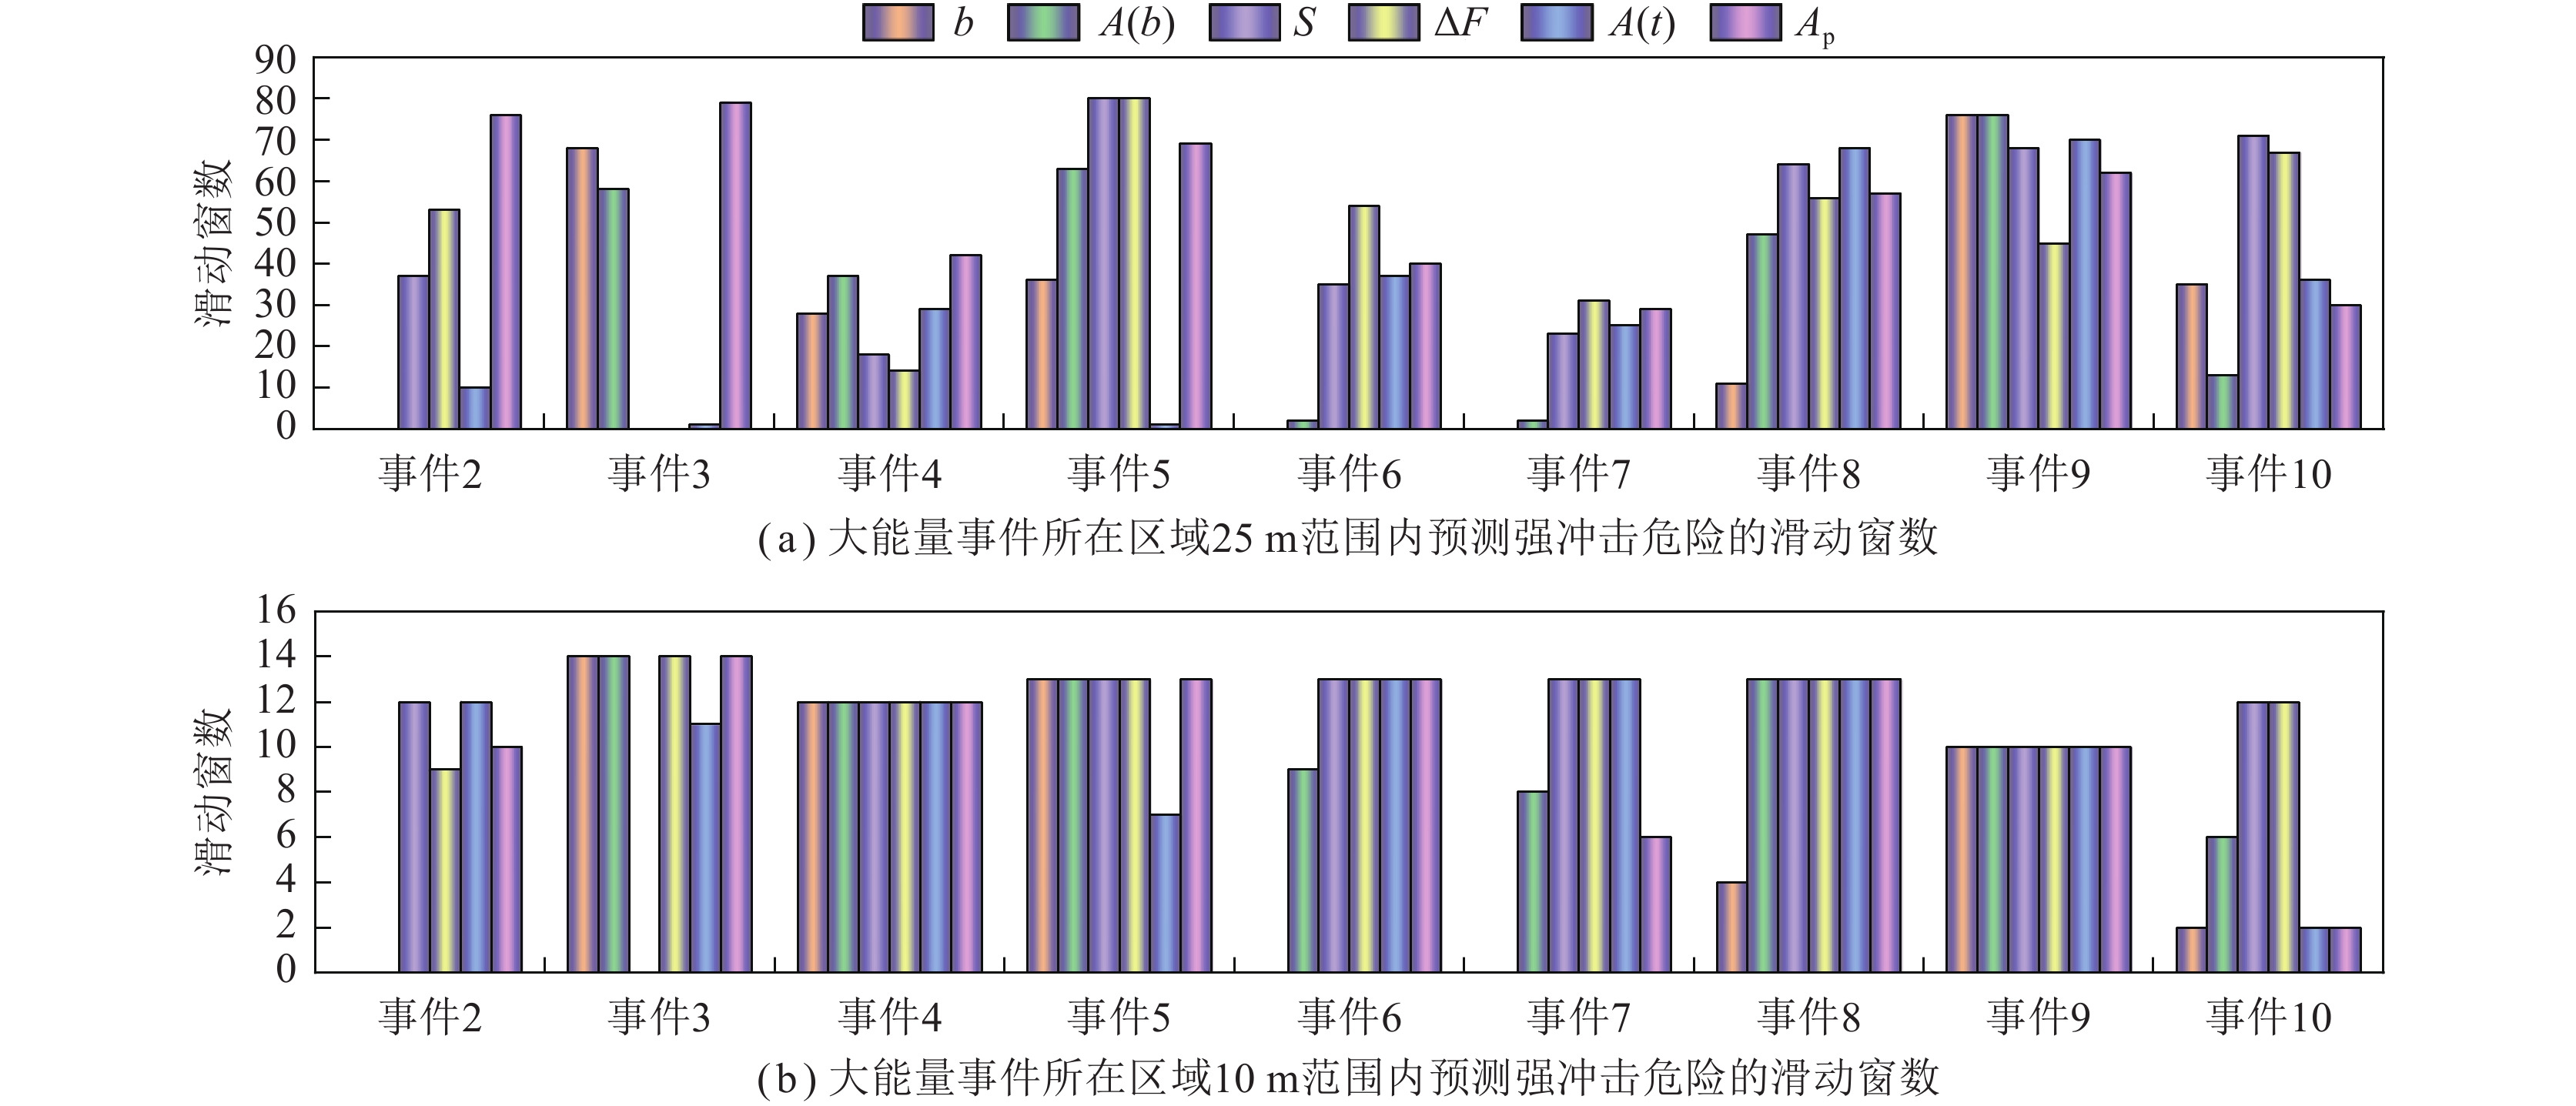
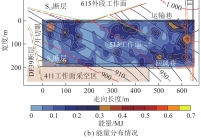
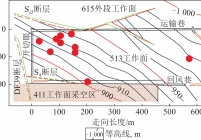
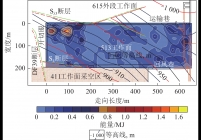
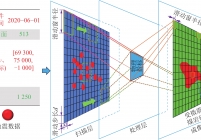
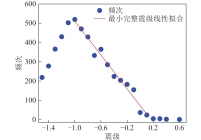
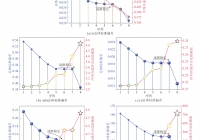
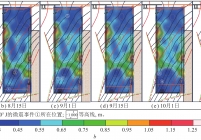
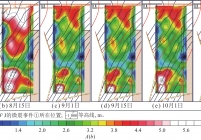
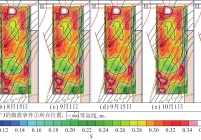
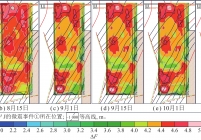
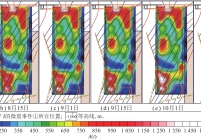
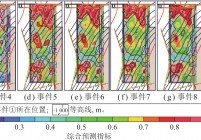
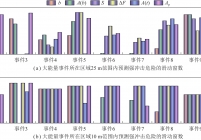
    精准识别冲击危险区域并给出危险程度及其演化规律对冲击地压防治具有重要意义。采用变形局部化与多元地球物理指标空间扫描相结合的方法,探究大能量事件发生区域的微震前兆特征,追踪冲击危险区域的动态演化过程。基于变形局部化原理,利用梯度显著性指标识别变形局部化区域,圈定冲击危险区域;采用滑动窗扫描方法,研究了变形局部化区域内的bA(b)、S等物理指标空间分布特征,以掘进期间梯度显著性指标识别的微震聚集区域内大能量微震事件对应的bA(b)、S、∆FA(t)作为划分工作面回采期间冲击危险等级的阈值;利用贝叶斯网络法分析各个物理指标预测危险区域的效能,构建综合预测危险区域模型,计算物理指标权重并得到综合预测指标,并以513工作面进行实例分析。结果表明:地球物理指标可以识别微震聚集信号,判断危险区域,根据513工作面实际监测数据判断出3个微震事件聚集区域;物理指标的空间扫描结果与微震数据的聚集区域具有同步的特征,大能量事件发生时,所在区域的物理指标值高于冲击危险阈值,物理指标空间扫描辨识的危险区域与微震数据聚集区域基本一致;利用综合预测危险区域模型,对工作面回采期间危险区域进行迭代式预测,结果表明:冲击危险事件多发生在综合预测指标所预测的强冲击危险区域内,并随着回采期间微震数据的叠加,强冲击危险区域逐步集中,与冲击危险事件位置的重合度更高。综合预测指标预测效能总体高于单个物理指标,显著增强了精准预测冲击危险区域的能力。

  • Abstract

    It is of great significance to accurately identify the rockburst hazard areas and give the hazard level and its evolution law for rockburst prevention and control. In this study, the method combining deformation localization with multivariate geophysical indicators spatial scanning is used to explore the precursor characteristics of microseismic in the area of high-energy microseismic events and track the dynamic evolution process of rockburst hazard areas. Based on the principle of deformation localization, the gradient significance indicator is used to identify the deformation localization areas and delineate the hazard area. The sliding window scanning method is used to study the spatial distribution characteristics of physical indicators such as b value, A(b) value and S value in the deformation localization areas. The b value, A(b) value, S value, ∆F and A(t) value corresponding to the high-energy microseismic events identified by the gradient significance index during excavation are used as the threshold values for classifying the rockbrust hazard level during the mining operation. The Bayesian network method is used to analyze the effectiveness of each physical indicator in predicting the hazard areas, and a comprehensive predicting hazard areas model is constructed to calculate the weight of physical indicators and obtain the comprehensive predicting indicators. The 513 working face is analyzed as an example. The results show that the geophysical indicators can identify the microseismic gathering signal and assess the hazard areas. Three microseismic events gathering areas are determined according to the measured data of 513 working face. The spatial scanning results of physical indicators and the gathering areas of microseismic data have the synchronization characteristics. When some high-energy microseismic events occur, the physical indicator value of the area is higher than the rockburst hazard threshold, and the hazard areas identified by the physical indicator spatial scanning is basically consistent with the gathering areas of microseismic data. The integrated prediction model is used to predict the hazard area during the mining period of the working face. The results show that the rockburst hazard events mostly occur in the strong high hazard areas predicted by the integrated prediction indicator. With the superposition of microseismic data during the mining period, the high rockburst hazard areas is further concentrated, and the overlap degree with the high hazard event location is higher. The prediction efficiency of the integrated prediction indicator is generally higher than that of single physical indicator, which significantly enhances the ability to accurately predict the rockburst hazard areas.

  • 关键词

    冲击地压变形局部化危险区域多元地球物理指标动态辨识

  • KeyWords

    rockburst;deformation failure localization;rockburst hazard areas;multivariate geophysical indicators;dynamic identification

  • 基金项目(Foundation)
    国家重点研发计划资助项目(2022YFC3004605);国家自然科学基金面上资助项目(52374201,51974150)
  • DOI
  • 引用格式
    王爱文,李超,潘一山,等. 冲击危险区域多元地球物理指标动态辨识方法及其应用[J]. 煤炭学报,2024,49(6):2573−2588.
  • Citation
    WANG Aiwen,LI Chao,PAN Yishan,et al. Dynamic identification method for rockburst hazard areas based on multivariate geophysical indicators and its application[J]. Journal of China Coal Society,2024,49(6):2573−2588.
  • 相关文章
  • 图表

    Table1

    物理指标表征特征
    指标 计算公式 参数含义 危险前变化趋势 指标的局限性
    b \( b = \dfrac{{0.434\;3N}}{{\displaystyle\sum\limits_{\delta = 1}^N {(M_{\delta} - {M_0} + 0.05)} }} \) N为微震总数,Mδ为微震震级,M0为样本点最小震级 大能量事件发生前,常为低值,表现为低值异常 难以识别突发的大能量事件
    A(b) \( A(b)=\dfrac{1}{b}\mathrm{lg}{\displaystyle \sum _{\delta=1}^{N}{10}^{bM_{\delta}}} \) b为震级–频度关系中计算的b值,Mδ为微震震级 A(b)与b相关,b越小,
    A(b)越大,即大能量发生前
    常出现高值异常
    该值是对b值的改进,对于
    突发的大能量事件识别
    效果较差
    S \( \begin{array}{l}S = 0.117\lg (N + 1) +\\ 0.029\lg \displaystyle\sum\limits_{\delta = 1}^N {{{10}^{1.5M_\delta }}}+ 0.015{M_{\max }} \end{array}\) N为微震总数,Mδ为微震震级,Mmax为微震最大震级 该值充分考虑了时空强因素,
    大能量事件发生在S增强后
    不易区分小能量事件和大能量
    事件的扰动
    F \( \Delta F = \lg \left( {\left( {{{\displaystyle\sum\limits_{i = 1}^N {{{10}^{6.11 + 1.09{M_\delta}}}} }}} \right)/{T}} \right) \) N为微震总数,T为时间,Mδ
    微震震级
    在强能量事件发生前,常出现
    高值异常
    人为选择的时间可影响
    最终的结果
    A(t) \( A(t) = \displaystyle\sum\limits_{k = k_0}^{k - 1} {N(k){{4.5}^{k - k_0}}} \) k0为所统计的微震能级下限,
    k为每个微震能级,N(k)为各能
    级对应的频次
    理论上在强能量释放前,A(t)
    出现高值异常,即表明在强
    能量释放前,微震活动性增强
    一个大能量事件计算出的值与
    多个小能量事件计算出的值
    产生耦合现象

    Table2

    微震能量与冲击危险等级
    能量e的范围对应冲击危险等级
    e≥1×10⁵ J
    5×10⁴ J≤e < 1×10⁵ J中等
    1×10⁴ J≤e < 5×10⁴ J
    e < 1×10⁴ J

    Table3

    发生大能量微震事件的物理指标值
    微震编号 微震发生时间 滑动窗采集微震数 b A(b) S F A(t)
    掘进事件1 2018–03–29 17 0.45 1.96 0.16 3.73 98.50
    掘进事件2 2018–05–10 29 0.37 3.29 0.19 4.00 193.61
    掘进事件3 2018–05–11 11 0.36 2.19 0.13 3.57 73.19
    掘进事件4 2018–06–26 4 0.34 1.17 0.07 3.17 29.04
    掘进事件5 2019–02–15 22 0.39 2.80 0.18 3.95 152.82
    掘进事件6 2019–06–03 55 0.46 2.96 0.23 4.15 285.35
    掘进事件7 2020–03–03 60 0.38 4.02 0.24 4.35 402.22
    掘进事件8 2020–04–04 50 0.45 2.94 0.22 4.06 252.42
    掘进事件9 2020–05–06 118 0.40 4.48 0.28 4.56 718.73
    掘进事件10 2020–05–07 45 0.43 3.05 0.22 4.10 253.45
    掘进事件11 2020–05–13 75 0.49 2.92 0.24 4.16 338.70
    掘进事件12 2020–05–14 49 0.41 3.33 0.22 4.10 272.95
    掘进事件13 2020–05–27 136 0.49 3.37 0.27 4.35 578.51

    Table4

    各危险等级物理指标值
    指标 强冲击危险 中等冲击危险 弱冲击危险 无冲击危险
    b 小于0.45 0.45~0.47 0.47~0.51 大于0.51
    A(b) 大于4.01 3.02~4.01 2.01~3.02 小于2.01
    S 大于0.27 0.17~0.27 0.15~0.17 小于0.15
    F 大于4.34 4.03~4.34 3.71~4.03 小于3.71
    A(t) 大于578.51 200.30~578.51 138.12~200.30 小于138.12

    Table5

    513回采期间10个微震事件信息
    事件序号 发生时间 坐标位置 相对位置
    ϕ 2020–06–01 [69 750,73 156,–912] 开切眼前方156 m 工作面运输巷右侧60 m
    κ 2020–06–13 [69 872,73 200,–896] 开切眼前方200 m 工作面回风巷右侧3 m
    λ 2020–08–19 [69 768,73 156,–959] 开切眼前方156 m 工作面运输巷右侧78 m
    μ 2020–08–27 [69 728,73 028,–907] 开切眼前方28 m 工作面运输巷右侧38 m
    ν 2020–09–06 [69 790,73 560,–993] 开切眼前方560 m 工作面运输巷右侧100 m
    ο 2020–09–10 [69 735,73 104,–910] 开切眼前方104 m 工作面运输巷右侧45 m
    π 2020–09–13 [69 709,73 104,–932] 开切眼前方104 m 工作面运输巷右侧19 m
    θ 2020–10–06 [69 702,73 143,–942] 开切眼前方143 m 工作面运输巷右侧12 m
    ρ 2020–10–11 [69 721,73 090,–925] 开切眼前方90 m 工作面运输巷右侧31 m
    σ 2020–10–24 [69 765,73 067,–960] 开切眼前方67 m 工作面运输巷右侧75 m

    Table6

    参与识别大能量事件总的滑动窗数
    事件12345678910
    滑动窗76768079817679797676

    Table7

    各个物理指标识别危险的滑动窗数
    回采事件 b A(b) S F A(t)
    1 71 70 19 7 29
    2 0 0 74 41 60
    3 80 79 25 21 44
    4 70 64 78 79 60
    5 65 76 81 81 57
    6 0 61 76 76 76
    7 1 51 79 77 64
    8 15 70 79 72 77
    9 24 62 76 76 73
    10 35 50 72 12 37

    Table8

    各指标权重
    预测事件 b A(b) S F A(t)
    事件2 0.36 0.36 0.10 0.03 0.15
    事件3 0.27 0.27 0.18 0.08 0.20
    事件4 0.29 0.29 0.15 0.08 0.19
    事件5 0.28 0.28 0.15 0.10 0.19
    事件6 0.26 0.26 0.17 0.13 0.18
    事件7 0.23 0.26 0.18 0.15 0.18
    事件8 0.21 0.25 0.19 0.16 0.19
    事件9 0.19 0.24 0.20 0.17 0.20
    事件10 0.17 0.24 0.21 0.18 0.20
相关问题

主办单位:煤炭科学研究总院有限公司 中国煤炭学会学术期刊工作委员会

©版权所有2015 煤炭科学研究总院有限公司 地址:北京市朝阳区和平里青年沟东路煤炭大厦 邮编:100013
京ICP备05086979号-16  技术支持:云智互联