
主办单位:煤炭科学研究总院有限公司、中国煤炭学会学术期刊工作委员会
Ecological environment quality evaluation of Zhangjiamao mining area based on DBO–PPC model
LIU Ying;FAN Yahui;HENG Wenjing;XU Pingping;YUE Hui;BI Yinli;NIU Hongbo;TIAN Shaoguo;ZU Pengju;CAO Manhong;DONG Qiguang
西安科技大学 测绘科学与技术学院西安科技大学 地质与环境学院西安科技大学 西部矿山生态环境修复研究院陕西省煤层气开发利用有限公司陕西生态产业有限公司
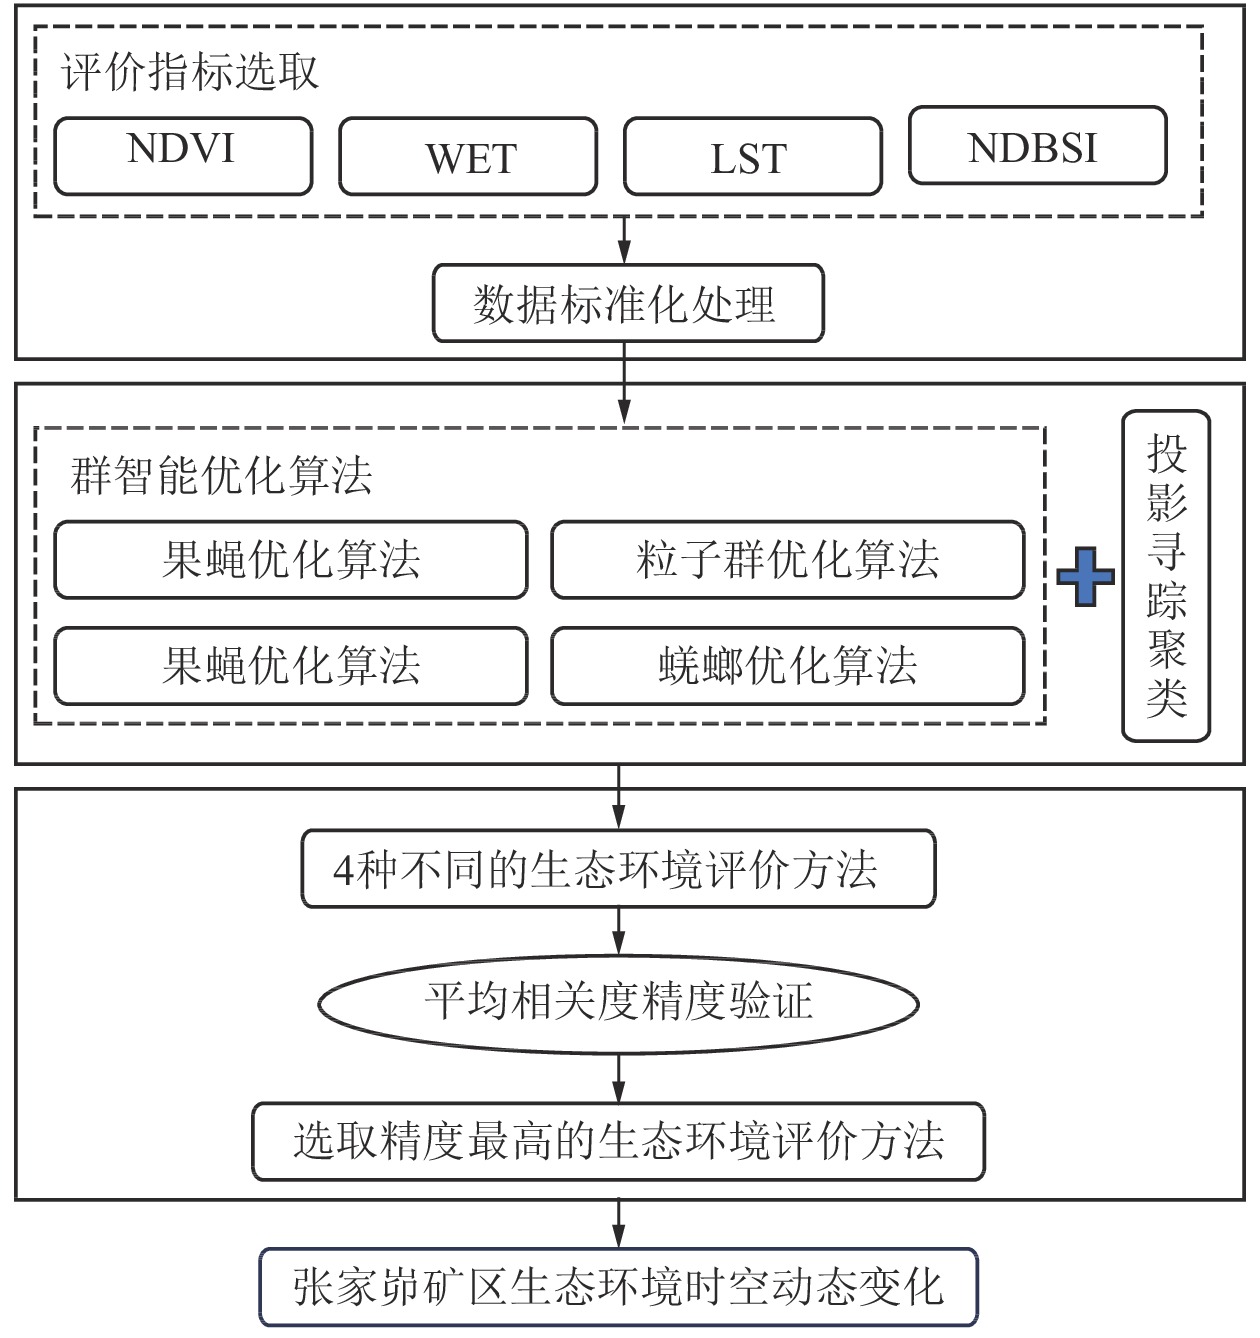
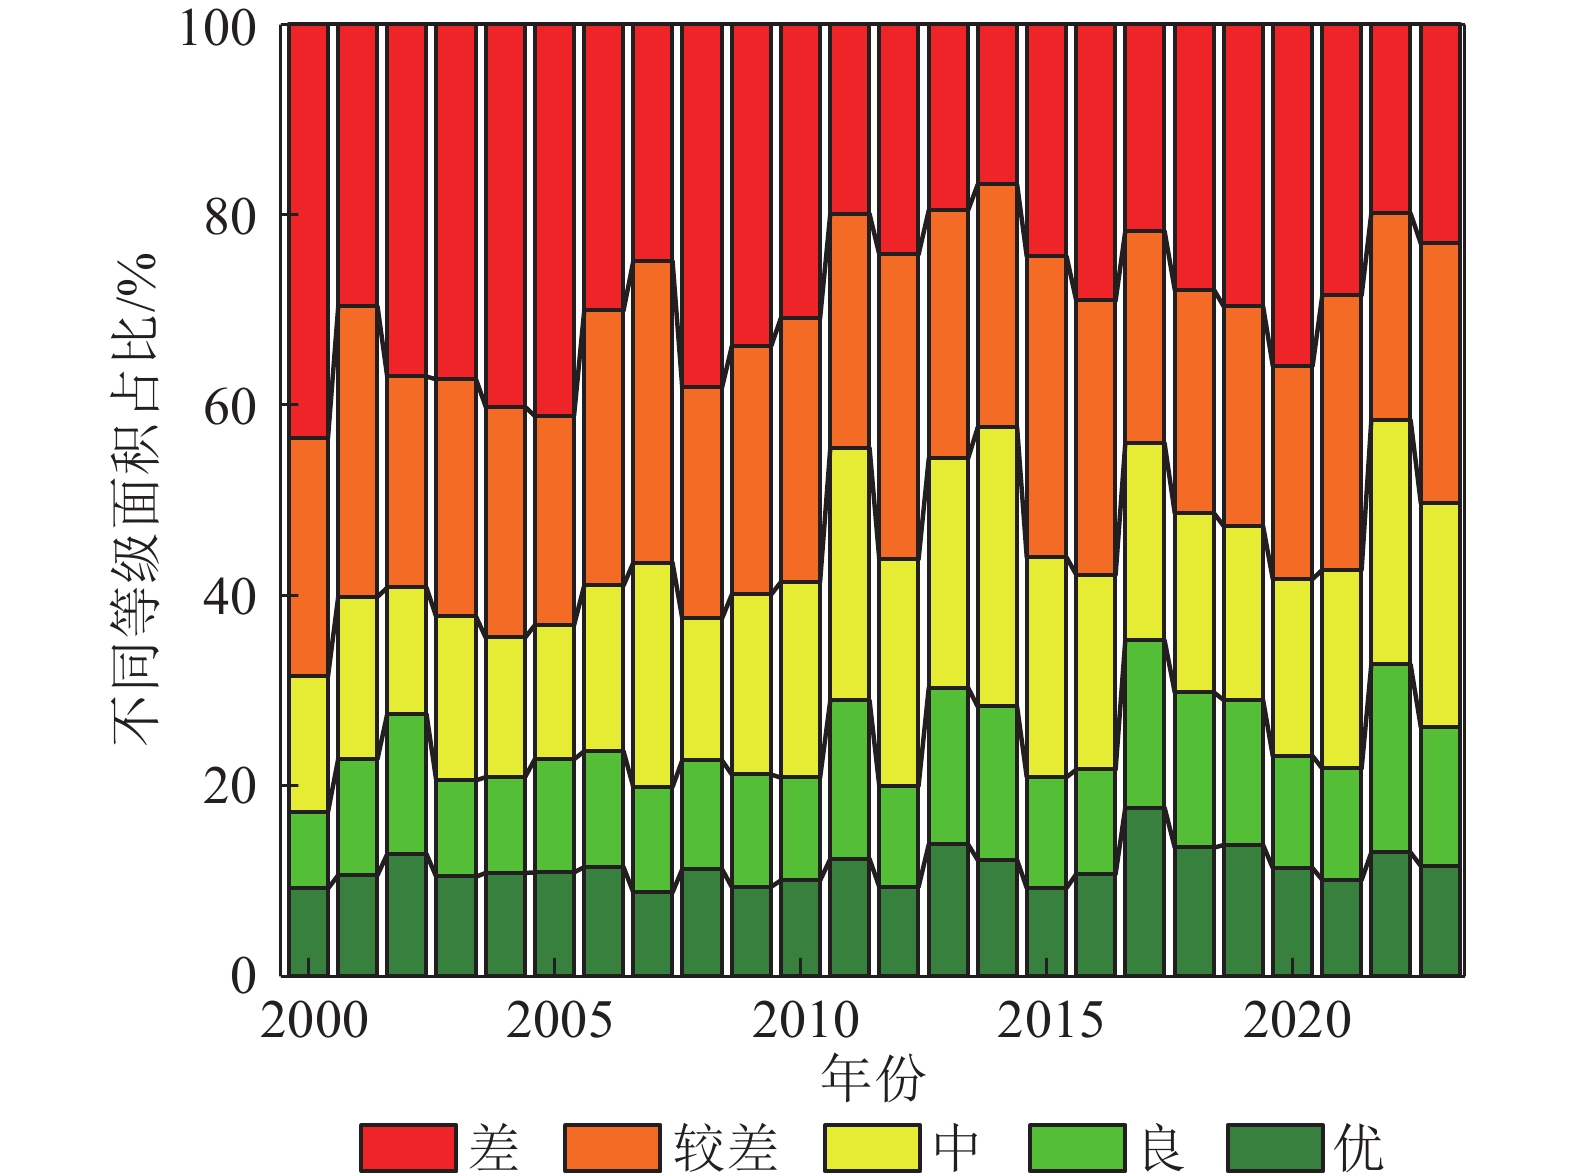
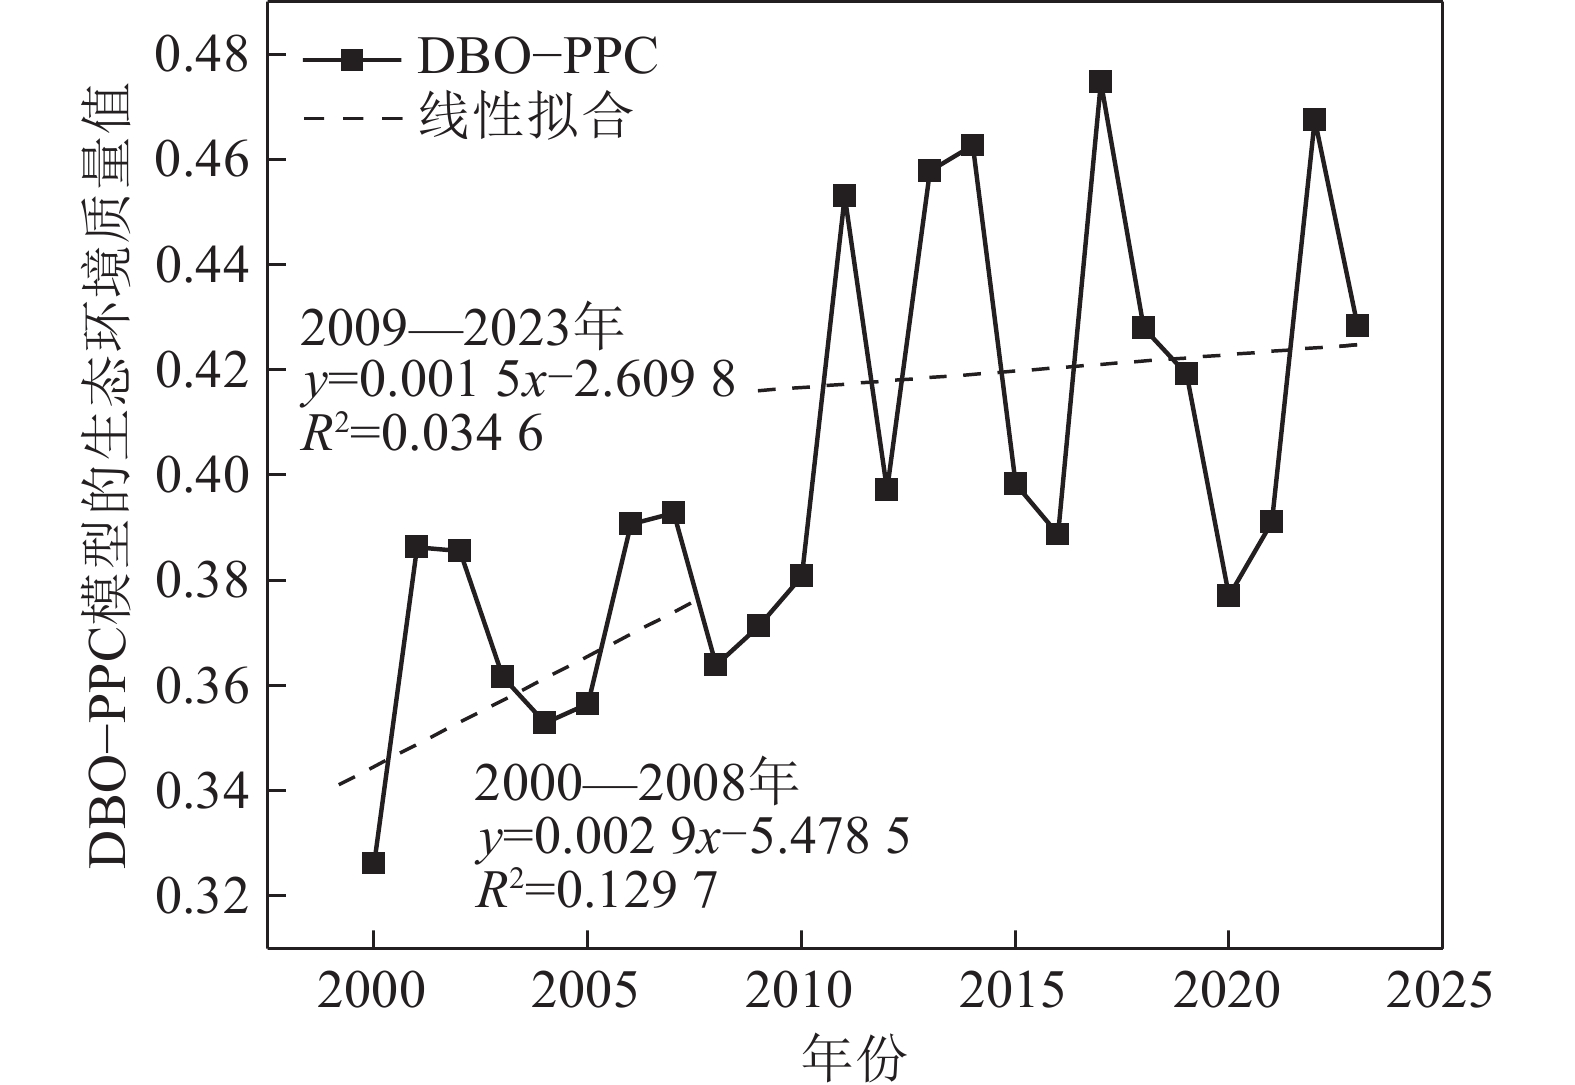
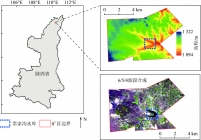
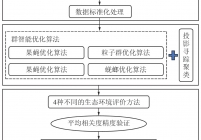
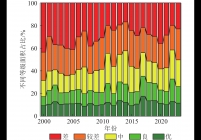
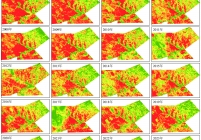
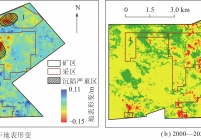
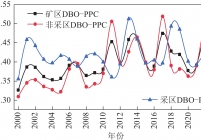
矿山开采会破坏和占用大量土地资源,对生态环境造成持久的负面影响,因此评价矿区生态环境质量变化迫在眉睫。为了准确监测矿区生态环境质量,以陕煤集团张家峁矿区2000—2023年24期逐年的Landsat影像为基础数据,通过计算绿度(Normalized Difference Vegetation Index,NDVI)、湿度(Humidity Index,WET)、热度(Land Surface Temperature,LST)、干度(Normalized Differential Build-up and bare Soil Index,NDBSI)4项生态指标,并采用基于果蝇优化算法的投影寻踪(Fruit Fly Optimization Algorithm-Projection Pursuit Clustering,FOA–PPC)、基于粒子群优化算法的投影寻踪(Particle Swarm Optimization-Projection Pursuit Clustering,PSO–PPC)、基于灰狼优化算法的投影寻踪(Grey Wolf Optimizer-Projection Pursuit Clustering,GWO–PPC)和基于蜣螂优化算法的投影寻踪(Dung Beetle Optimizer-Projection Pursuit Clustering,DBO–PPC)4种群智能优化算法构建矿区生态环境质量评价方法,并利用平均相关度进行精度验证。结果表明:① DBO–PPC模型的平均相关度和类内聚集度均高于PSO–PPC模型、FOA–PPC模型和GWO–PPC模型,且与EI指数更接近,表明DBO–PPC能更好的评估研究区生态环境;② 基于DBO–PPC模型的张家峁矿区2000—2023年生态环境质量均值为0.4,生态环境质量以差和较差等级为主,面积占比约55.94%,空间上呈西部差东部好,常家沟水库的生态环境在研究期内表现为优等级,矿区东北部和中部区域的生态环境较好,植被覆盖较多;③ 矿区发生沉陷面积占比为81.28%,沉陷最大值达−0.15 m;采区发生沉陷现象面积占比明显高于矿区,占采区面积的89.56%,生态环境质量以−0.000 4的速率下降,表明采矿活动使得研究区的地表发生了沉陷,进而影响到生态环境。综上所述DBO–PPC模型在监测评价矿区生态环境质量方面具有较强的合理性,从而为矿区生态环境可持续发展提供技术手段。
Mining will destroy and occupy a large amount of land resources and cause lasting negative impact on ecological environment, so it is urgent to evaluate the change of ecological environment quality in mining area. In order to accurately monitor the ecological environment quality of the mining area, this study took 24 annual Landsat images of the Zhangjiamao Mining area from 2000 to 2023 as the basic data, and calculated four ecological indicators of NDVI (Normalized Difference Vegetation Index, NDVI), WET (Humidity Index, WET), LST (Land Surface Temperature, LST) and NDBSI (Normalized Differential Build-up and bare Soil Index, NDBSI). In addition, four population intelligent optimization algorithms including the Fruit Fly Optimization Algorithm-Projection Pursuit Clustering (FOA–PPC), the Particle Swarm Optimization-Projection Pursuit Clustering (PSO–PPC), the Grey Wolf Optimizer-Projection Pursuit Clustering (GWO–PPC) and the Dung Beetle Optimizer-Projection Pursuit Clustering (DBO–PPC) were used to derive the ecological environment quality evaluation method in the mining area, and the average correlation was used to verify the accuracy. The results showed that: ① The average correlation and intra class aggregation of the DBO–PPC model are higher than those of the PSO–PPC model, FOA–PPC model, and GWO–PPC model, and are closer to the EI index, indicating that the DBO–PPC model can better evaluate the ecological environment of the study area; ② Based on the DBO–PPC model, the average ecological and environmental quality of the Zhangjiamao mining area from 2000 to 2023 is about 0.4, and the ecological and environmental quality is mainly poor or relatively poor, accounting for about 55.94% of the total area. In terms of space, the ecological environment of the Changjiagou Reservoir is superior during the study period. The ecological environment in the northeastern and central areas of the mining area is better, with more vegetation coverage. ③ The proportion of subsidence area in the mining area is 81.28%, and the maximum subsidence is –0.15 m. Subsidence in the coal extraction area is significantly higher than that in the whole mining area, accounting for 89.56% of the coal extraction area, and the ecological environment quality decreases at a rate of –0.000 4, indicating that mining activities cause surface subsidence in the study area, which further affects the ecological environment. To sum up, the DBO–PPC model has a strong rationality in monitoring and evaluating the ecological environment quality in the mining areas, so as to provide technical means for the sustainable development of ecological environment in the mining areas.
Swarm intelligent optimization algorithm;projection pursuit;DBO–PPC;ecological environment evaluation


主办单位:煤炭科学研究总院有限公司 中国煤炭学会学术期刊工作委员会
 煤炭学报
煤炭学报  2024年第06期